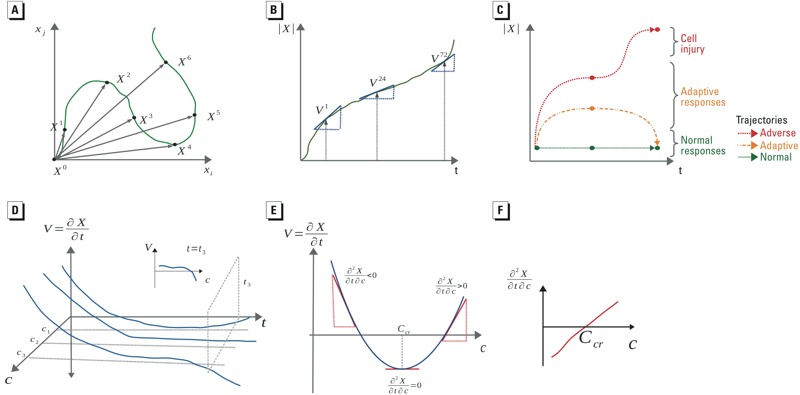
Figure 1.

Hypothetical dynamic system perturbations as trajectories and calculation of tipping points. (A) The green curve depicts a hypothetical trajectory across observations at time t (Xt) shown on the basis of two endpoints (xi and xj). (B) The perturbation velocity (V) is calculated as the derivative of the scalar perturbation (|X |) with respect to time (shown in green). (C) Three different types of trajectories are shown using |X |: trajectories that describe the normal behavior of the system (shown in green); adaptive trajectories, which include some perturbation of the system state followed by recovery (shown in orange); and adverse trajectories that show initial adaptive responses followed by lack of recovery at later times (shown in red). (D) The relationship between the velocity, concentration, and time is given by a continuous surface, V = f(c,t). (E) The rate of change of velocity with respect to concentration is given by ∂cV = ∂V/∂c = ∂2 X/∂t∂c. (F) Solving ∂cV = 0 gives the critical concentration, Ccr.
