
Figure 2.
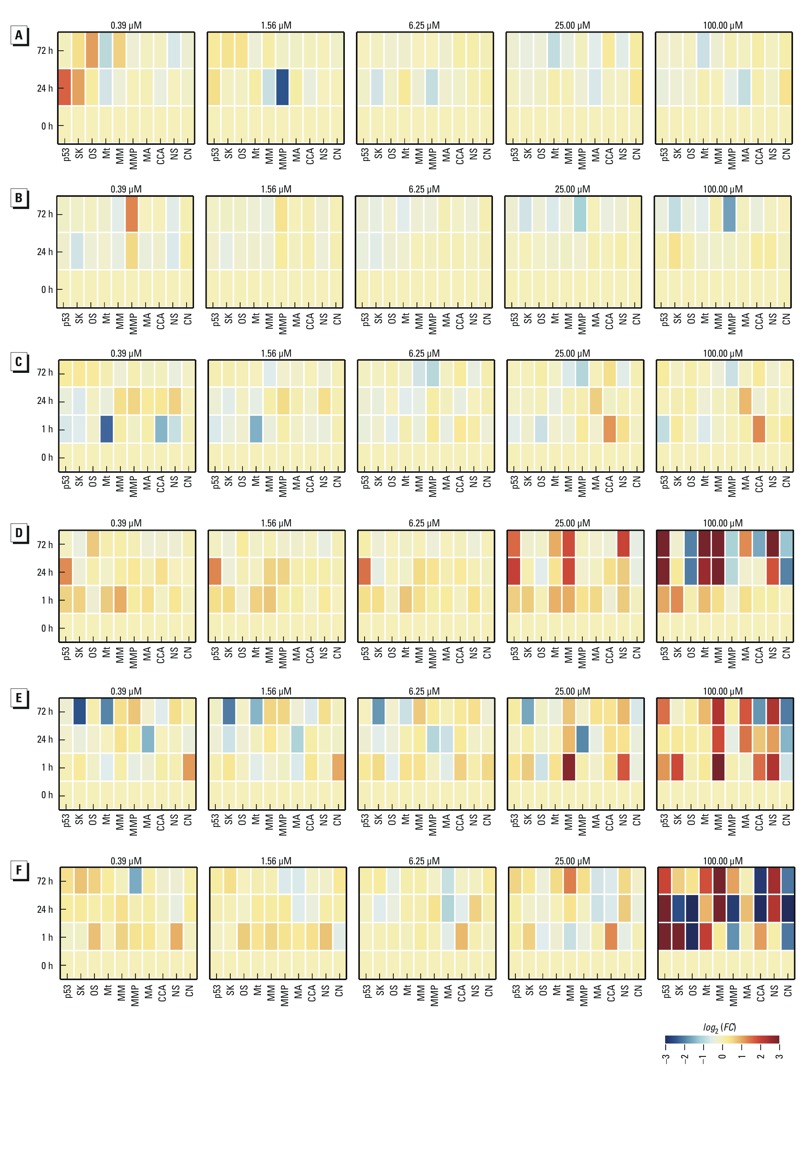
Concentration and time-dependent perturbations produced by chemicals. From top to bottom, each row of heat maps shows the perturbations produced by increasing concentrations of (A) octanoic acid, (B) dimethyl terephthalate, (C) chlorpyrifos-methyl, (D) butachlor, (E) dicofol, and (F) oxadiazon. Each heat map shows the end points (columns), time in hours (rows), and perturbations (colors) produced by each concentration (title). The end points include p53 activity, stress kinase (SK), oxidative stress (OS), microtubules (Mt), mitochondrial mass (MM), mitochondrial membrane potential (MMP), mitotic arrest (MA), cell cycle arrest (CCA), nuclear size (NS), and cell number (CN). The colors signify no effect (yellow), increase (red), and decrease (blue), and the magnitude of the changes is indicated by the color bar in the lower right corner.