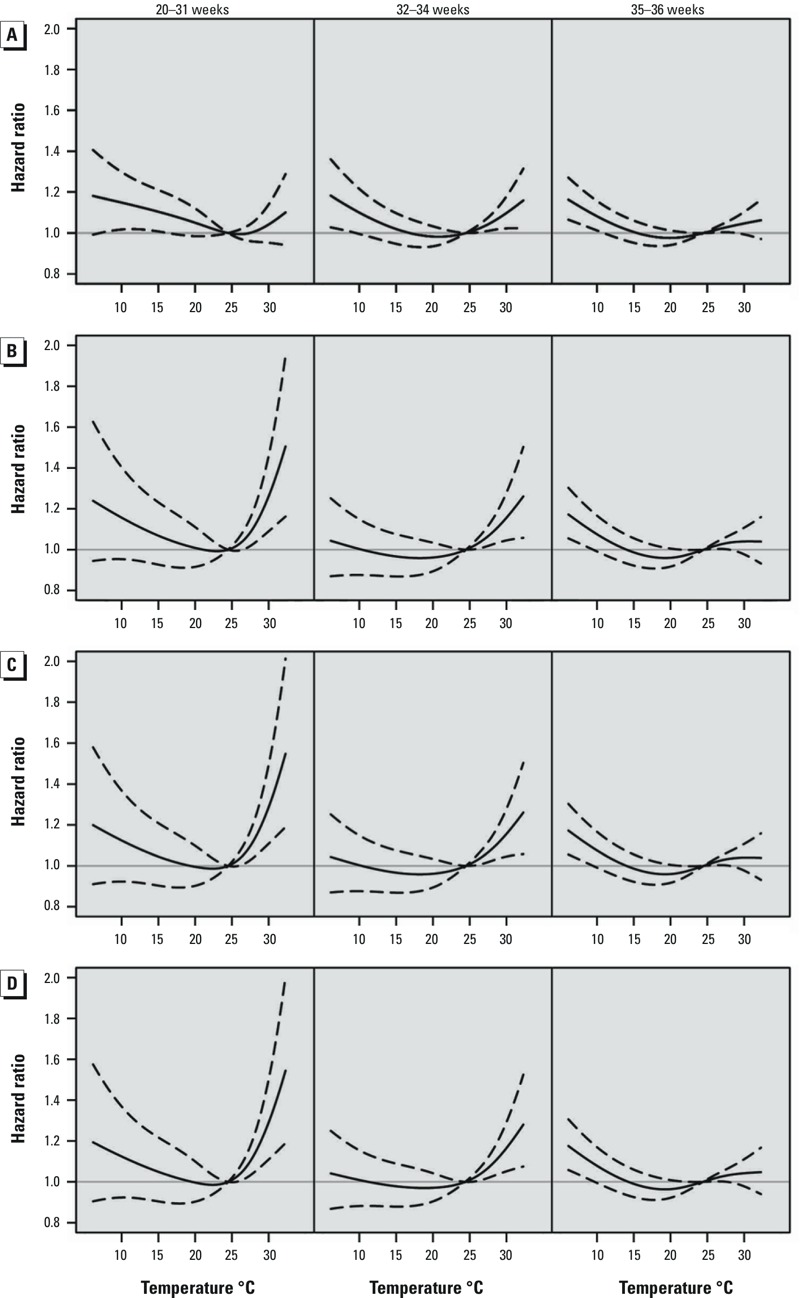
Figure 4.

Adjusted hazard ratios (solid line) and 95% confidence intervals (dashed lines) for preterm birth (during weeks 20–31, 32–34, and 35–36) in association with weekly average temperature modeled as a time-dependent variable during four time windows: 1-week (A), 4-week (B), late pregnancy (C), and cumulative (D). Estimates are relative to the median temperature for the study area (24.4°C). All values are based on Cox proportional hazards models with gestational age as the underlying time axis and adjusted for maternal age, education, parity, baby’s sex, year and month of conception, and relative humidity (during the corresponding time window).
