
Figure 1.
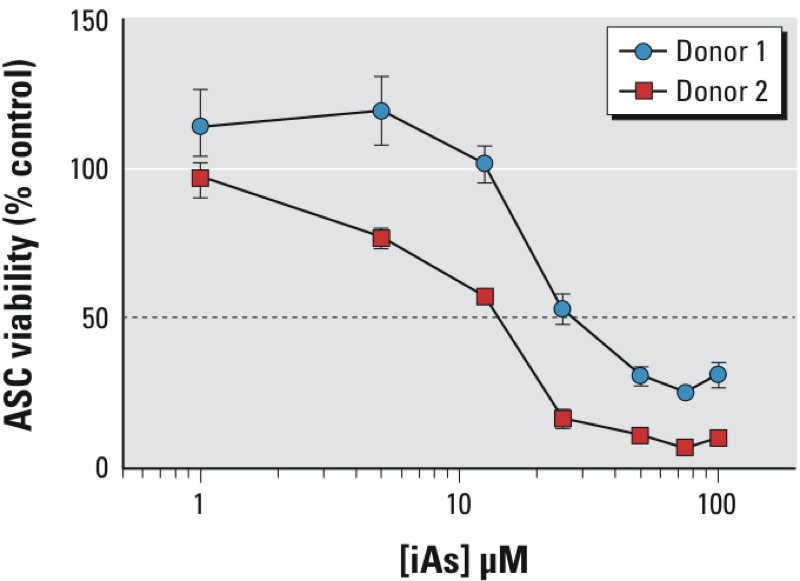
ASC viability after iAs exposure. Graph represents ASC (adipose-derived mesenchymal/stromal cell) viability after 48 hr of inorganic arsenic (iAs) exposure for two biological ASC donors. The results are displayed as the mean ± SEM (n = 3) normalized to percent control (0 ppb) for each individual donor. The dotted line represents the IC50.