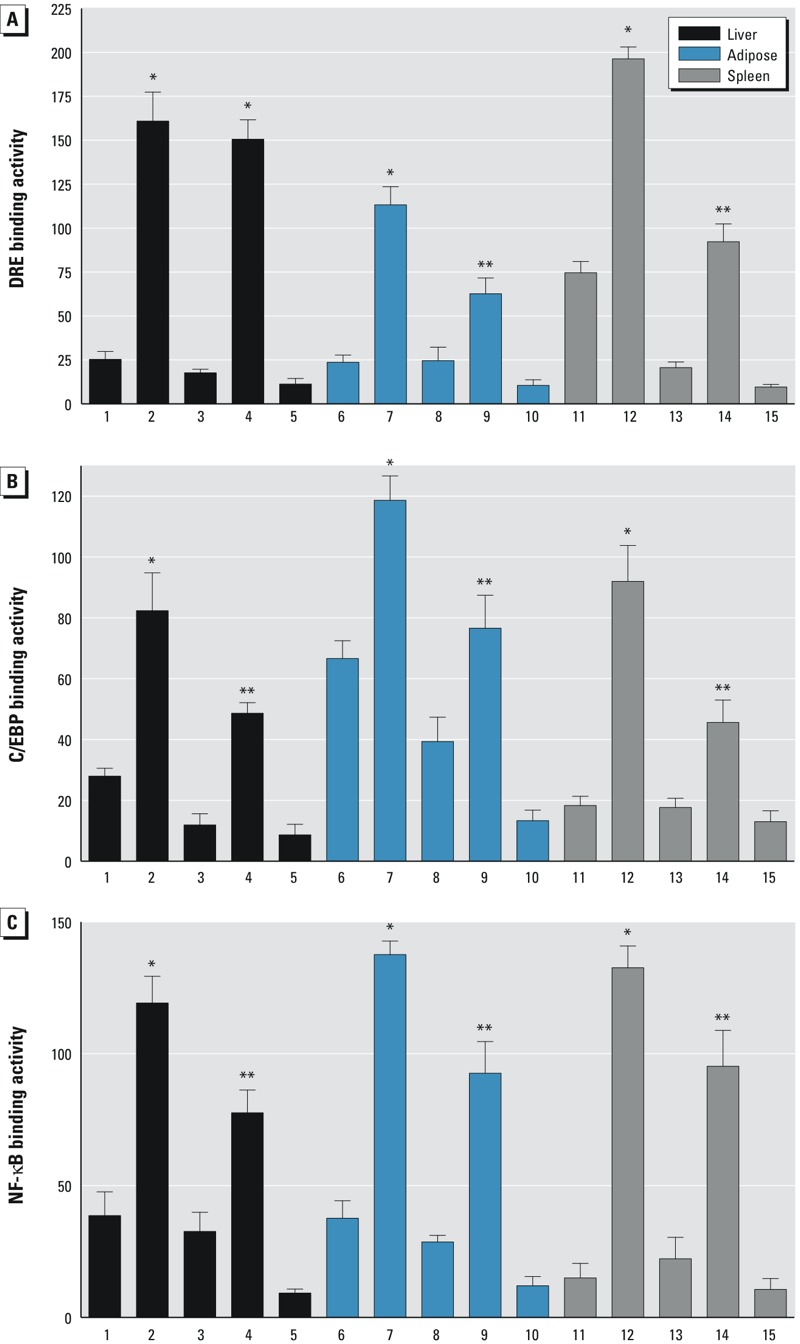
Figure 8.

Densitometric evaluation of band intensities of the DNA binding complexes. Band intensities of DNA binding complexes of nuclear proteins to (A) DRE (B) C/EBP, and (C) NF-κB consensus elements are shown as densitometry data. Numbers on the x-axes correspond to the lane numbers shown in Figure 7. Averages for each tissue from three different mice are shown as mean values ± SD. *Significantly different from wt control, p < 0.05. **Significantly different from wt TCDD, p < 0.05, by two-tailed Student’s t-test.
