
Figure 3.
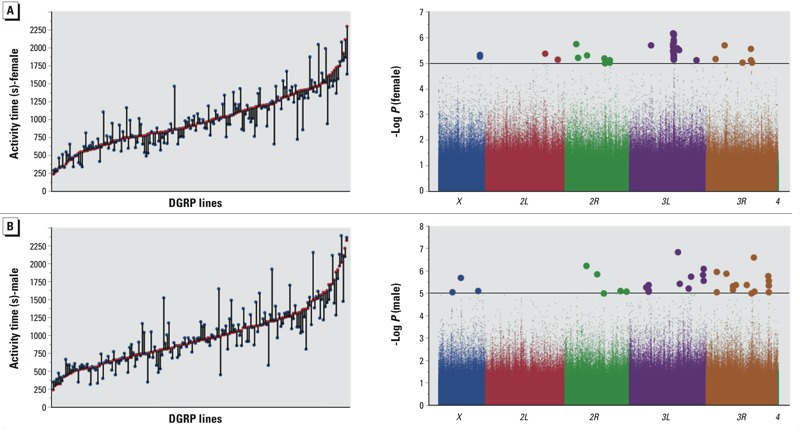
Phenotypic variation (left panels) and genome-wide associations (right panels) for sensitivity to lead exposure for adult locomotor activity of females (A) and males (B). In the left panels, x-axes indicate 166 individual DGRP lines, red symbols correspond to flies grown on control medium, and blue symbols correspond to flies reared on medium supplemented with 0.5 mM lead acetate. The differences between the two growth conditions, illustrated by the vertical connecting lines, represent the sensitivity to lead exposure, used for the GWA analyses shown by the Manhattan plots on the right. The chromosome arms are color coded and polymorphic markers above the horizontal line, which designates the p < 10–5 statistical threshold, are shown as larger circles.