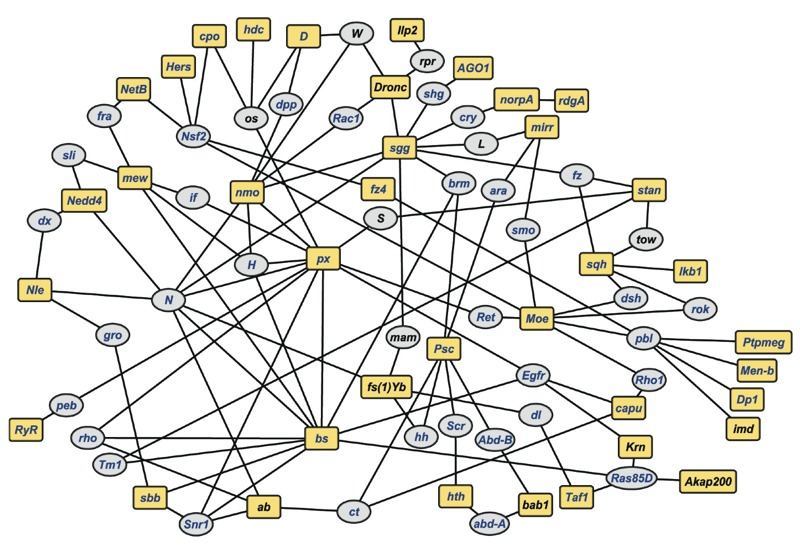
Figure 5.

A genetic network for susceptibility to lead exposure. The network was derived from candidate genes identified in GWA analyses for development time, viability and activity (see Excel Files S1, S2, S7). Yellow square boxes indicate candidate genes associated with any of these traits, while gray ovals represent computationally recruited intermediate genes. Blue font indicates genes with human orthologs, identified with the DRSC Integrative Ortholog Prediction Tool (Hu et al. 2011). Drosophila gene annotations are based on Flybase, version 5.49 (http://www.flybase.org). See also Excel File S9 for detailed connections between genes in the network.
