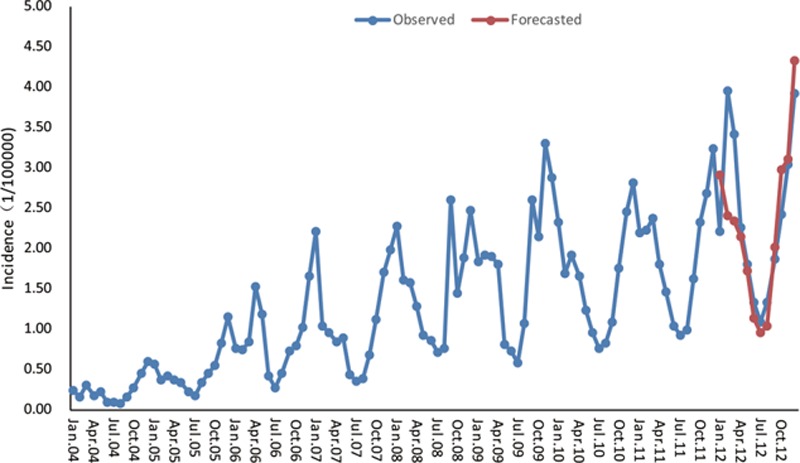
Figure 6.

SARIMA (0,1,1)(0,1,1)12-fitted influenza time series (Jan. 2004–Dec. 2011) and forecasted incidence (Jan. 2012–Dec. 2012) in the Hebei Province. The blue dotted line represents the observed values of influenza incidence from 2004 to 2012, and the red dotted line represents the SARIMA (0,1,1)(0,1,1)12 model's fitted curve of 2012. SARIMA = seasonal autoregressive integrated moving average.
