
Figure 3.
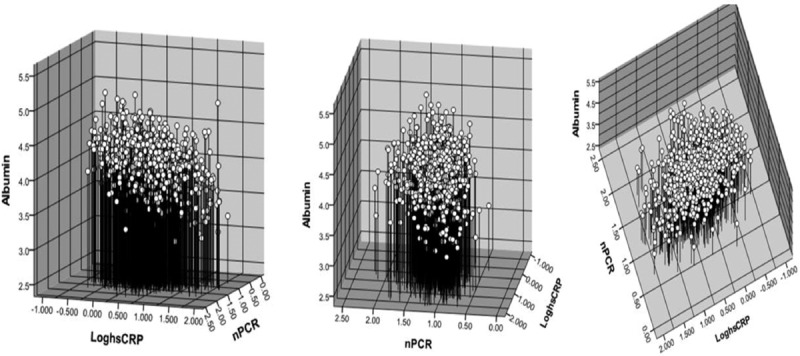
Relationship between the dependent variable, albumin and nPCR, and log-transformed hsCRP concentration is represented in 3-dimensional style. The following formula was the result for determining the correlation between serum albumin level and protein intake and inflammation: albumin = 3.95 − (0.193 × log hsCRP) + (0.181 × nPCR). The relationship between variables: albumin and log hsCRP: r = −0.304, P < 0.001; albumin and nPCR: r = 0.174, P < 0.001; log hsCRP and nPCR: r = −0.102, P = 0.003. hsCRP = high-sensitivity C-reactive protein, nPCR = normalized protein catabolic rate.