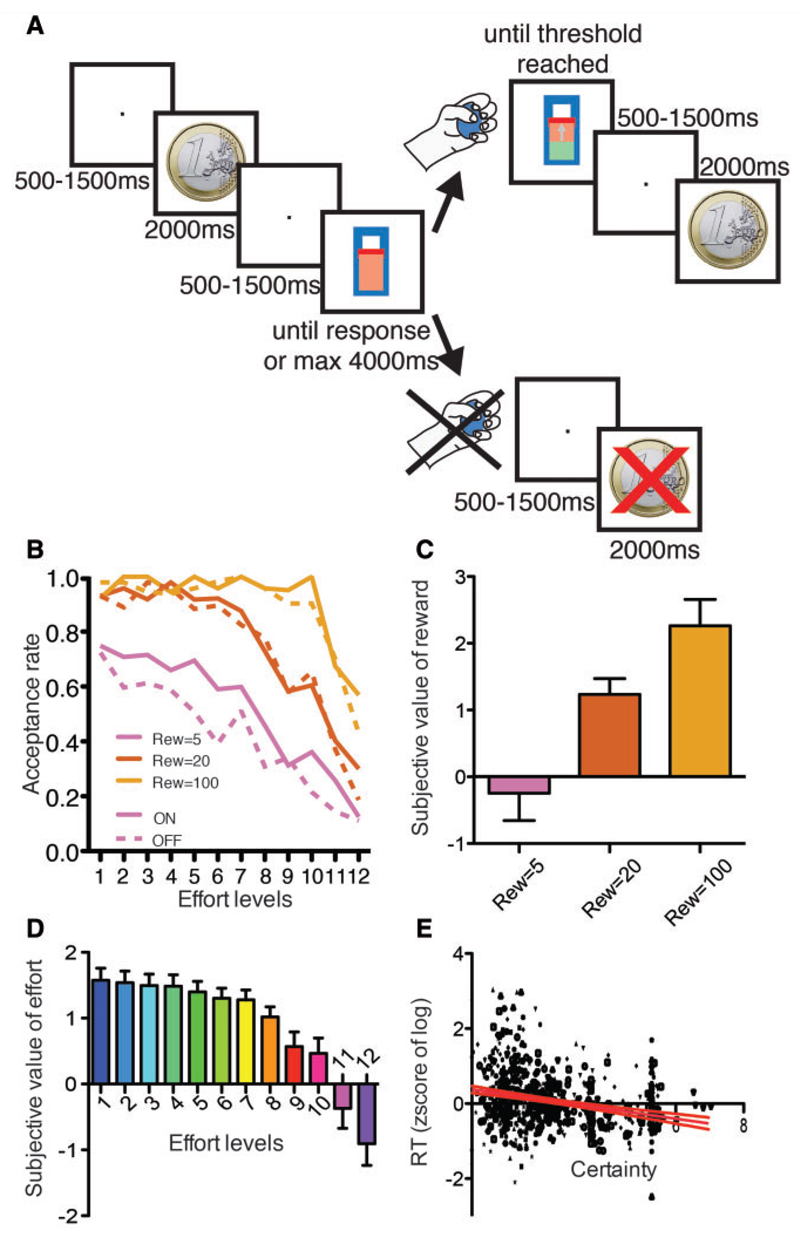
Figure 1. Behavioural task and performance.
(A) Schematic depiction of the task. (B) The proportion of accepted trials is shown as a function of the effort required (x-axis), the reward condition (pink: 5 c, red: 20 c, orange: €1) and the treatment condition (ON: solid; OFF: dashed). (C) Subjective value of reward as a function of the objective reward amount. Error bars indicate the standard error of the mean. (D) Subjective cost of effort as a function of the effort level. (E) The reaction time is plotted as a function of certainty. Each dot corresponds to an accepted trial, and each shape is specific to a particular subject. The red lines indicate the 95% confidence interval around the line of regression.

