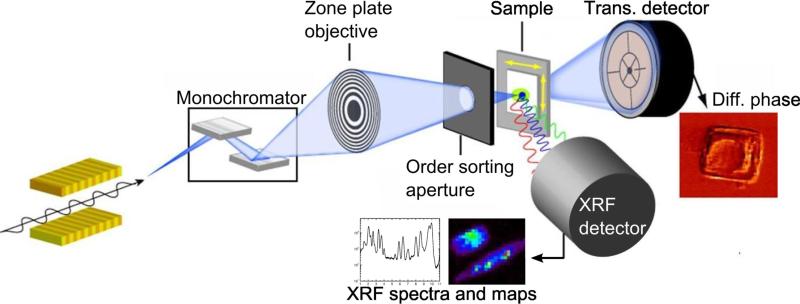
Figure 1.
Schematic of a synchrotron-based x-ray fluorescence micro/nanoprobe. A monochromatized x-ray beam is focused onto the sample using a zone plate. While the sample is raster scanned, x-ray fluorescence spectra are recorded, forming 2D elemental maps and 3D reconstructions in tomography mode. Differential phase contrast images are produced from transmission signals recorded using a quadrant photodiode. This figure was adapted from Figure 6 of [3].

