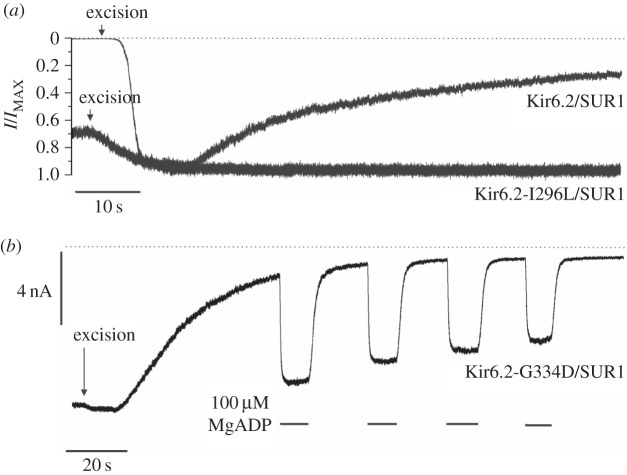
Figure 1.
Rundown and decline of MgADP activation of KATP currents. (a) Representative recordings of macroscopic Kir6.2/SUR1 and Kir6.2-I296L/SUR1 currents at −60 mV in excised patches from Xenopus oocytes. For clarity of comparison, the currents are normalized to their maximal value after patch excision (IMAX). The dotted line indicates the zero current level and patch excision is marked with an arrow. The methods and solutions used are as described in [6]. (b) Representative recording of macroscopic Kir6.2-G334D/SUR1 current at −60 mV in an excised patch from Xenopus oocytes. Repetitive applications of 100 µM MgADP to the cytosolic side of the membrane are denoted by the bars. The dotted line presents the zero current level. The methods and solutions used are as described in [6].

