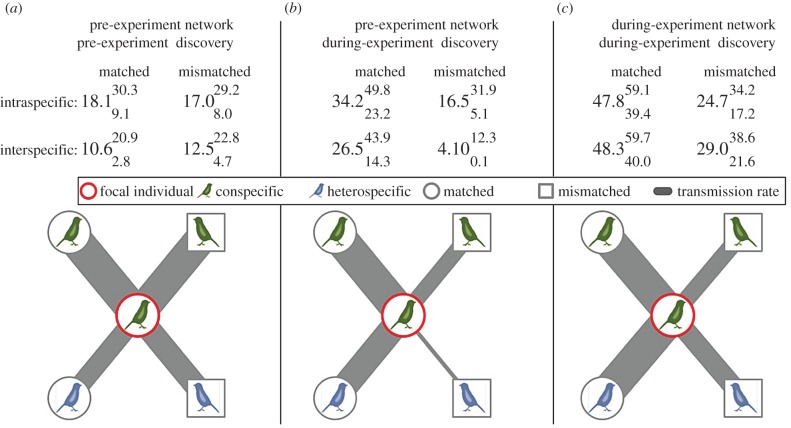
Figure 1.
Results of network-based diffusion analysis using: (a) pre-experimental network to predict patch discoveries pre-experiment, (b) pre-experimental network to predict patch discoveries during experiment and (c) network during experiment to predict patch discoveries during the experiment. Grids show model-averaged estimates of s for each network type (upper and lower 95% intervals as superscript and subscript, respectively). Diagrams illustrate information transfer between a focal individual (centre) and different types of individual with which they hold equal social associations to within the network (types correspond to grid values). ‘Matched’ refers to individuals who could access the same selective feeder stations as the focal and ‘mismatched’ refers to those who could only access different stations from them. Line thickness shows relative value of s within each panel (scaled by maximum s estimate); direct comparisons across panels are difficult as parameter estimates also depend on the accuracy and density of the social network.

