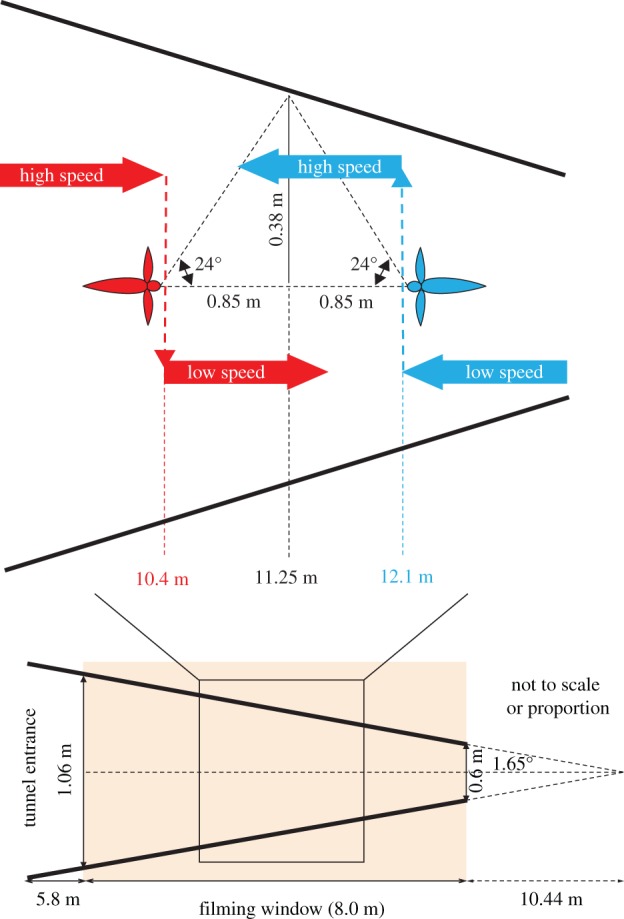
Figure 2.

Schematic of bird flight through the tapered tunnel in the narrowing direction (red) and the widening direction (blue), showing the locations at which the flight speed drops from ‘high’ to ‘low’ (dashed red arrow) and increases from ‘low’ to ‘high’ (dashed blue arrow), based on the data shown in figure 1. Note: This figure is not to scale or proportion.
