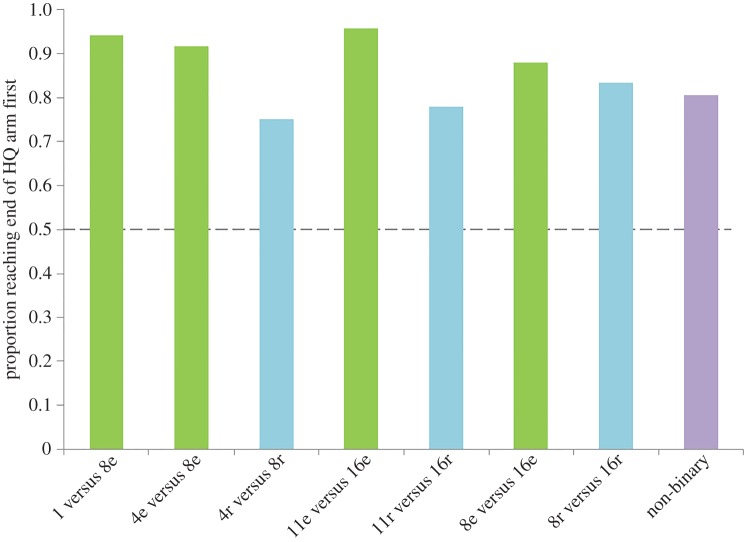
Figure 3.
Proportion of replicates in each treatment that reached the end of the HQ arm before they reached the end of the LQ arm. All treatments showed a proportion reaching the end of the HQ arm significantly greater than what would be expected by chance or if the cell could not choose between the two environments (dashed line, 0.5. Binomial test. For p-values, see the electronic supplementary material, table S1). Only treatments containing two different quality environments are shown. (Online version in colour.)

