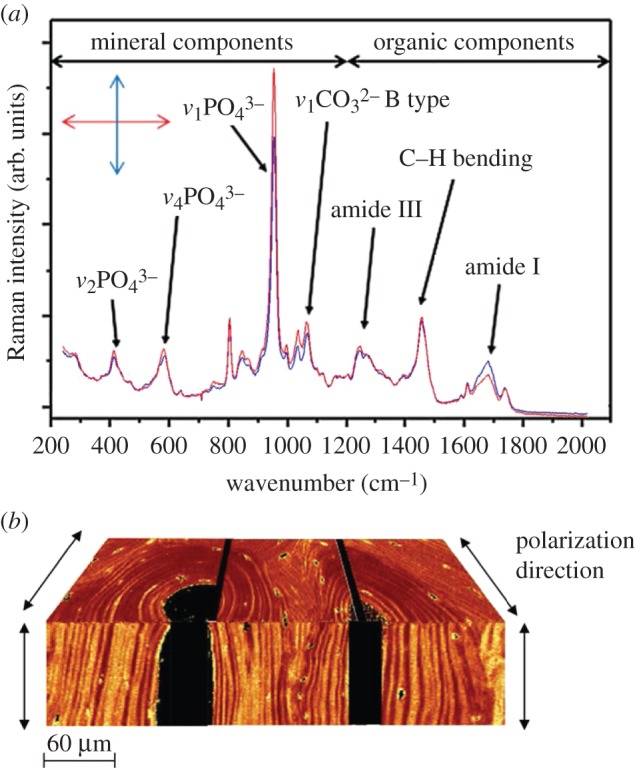
Figure 3.

Determining bone ultrastructure organization with Raman spectroscopy. (a) Two Raman spectra of human vertebral trabecular bone embedded in polymethyl methacrylate, where the most important peaks are identified. Spectra were acquired under orthogonal laser polarization directions (double-headed arrow inset). Analysis of the differences in the heights or areas under peaks, such as the v1 phosphate peak (approx. 960 cm−1) or the amide I peak (approx. 1650 cm−1), can provide the ultrastructure orientation. (Image from [67] with kind permission of PLoS, peak assignments according to [81].) (b) A composite of 2D images based on polarized Raman spectral analysis, resulting in a 3D representation of two orthogonal planes of an osteonal structure of human cortical bone. The colour intensity corresponds to the v1 phosphate to amide I ratio, with a spatial resolution of 1–2 mm. (Image from [82] with kind permission of Elsevier.) (Online version in colour.)
