Figure 8.

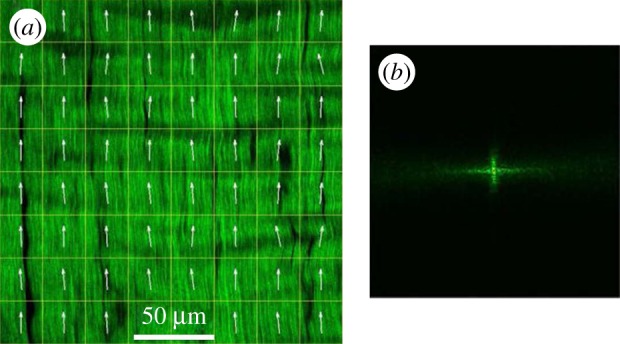
Typical ultrastructure orientation analysis for the presented imaging techniques. (a) Tendon collagen fibres imaged using second harmonic generation microscopy. The image is split into multiple compartments, in each of which the orientation is determined via an orientation-specific image-processing algorithm. (b) FT of a single compartment in (a), to retrieve the 2D orientation of the fibres in this compartment. FT is the most common method to retrieve orientation information from the data in imaging techniques. (a,b) The spatial resolution of imaging techniques, where the orientation-specific information is derived as a by-product, has to be in the sub-micrometre range, so that fibres can be identified, which limits the FOV that can be covered. Also, the necessary compartmentalization (white grid in (a)) reduces the ultrastructure organization analysis resolution (here it is reduced to approx. 25 µm). Moreover, irrelevant structural features (such as the blood vessels that appear black in figure 8a), or possible imaging artefacts, are also taken into account, unless special care is taken to eliminate their influence of the orientation-specific measures. (Image from [59] with kind permission of OSA publishing.) (Online version in colour.)
