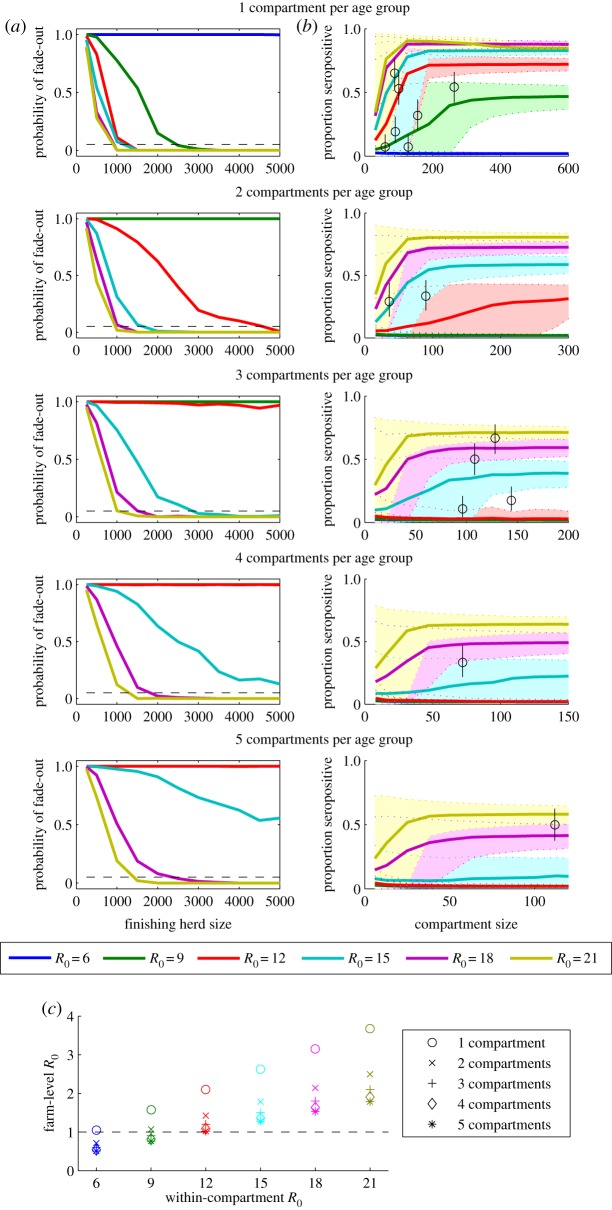
Figure 3.
Impact of mixing assumptions on model-predicted persistence and seroprevalence patterns of swine influenza in finishing herds. (a) The probability of stochastic fade-out of infection is plotted for finishing herds ranging in size from 250 to 5000 pigs. We model 1–5 compartments per age group, and assumed the transmission rate among pigs within the same age-specific compartment is 10-times higher than the transmission rate among pigs in different compartments. The coloured lines represent the model-predicted probability of fade-out for values of R0 between 1.5 and 5, while the dashed black line represents F = 0.05. (b) The model-predicted mean seroprevalence of influenza prior to slaughter (22–24 weeks of age) is represented by the coloured lines, while the shaded regions between the dotted coloured lines represent the corresponding 95% prediction intervals. The black circles represent the mean seroprevalence of H1N1, H1N2 and H3N2 antibodies observed among finishing pigs from farms of varying size in The Netherlands, while the black lines are the corresponding 95% CIs. Total finishing herd sizes are indicated on the left-hand plots, while the corresponding compartment sizes for a given herd size and number of compartments are indicated on the right-hand plots. Births and the movement of pigs from one site to the next are assumed to occur every three weeks. (c) The relationship between the within-compartment R0 and the farm-level R0 depends on the number of compartments per age group.

