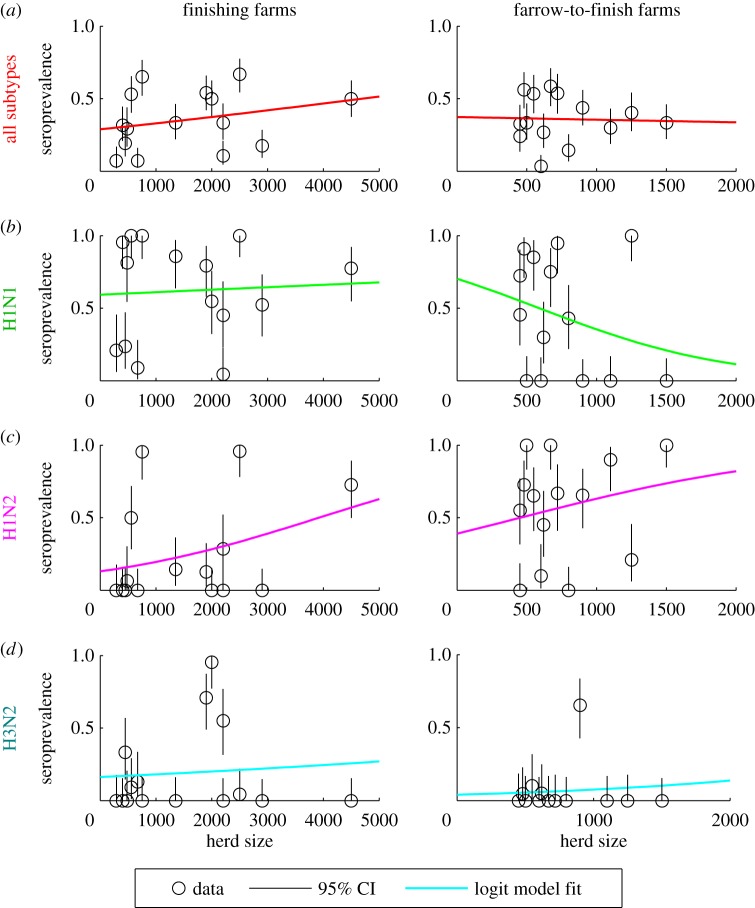
Figure 5.
Relationship between finishing herd size and swine influenza seroprevalence among Dutch finishing and farrow-to-finish herds. The seroprevalence data (black circles) for (a) all subtypes, (b) H1N1, (c) H1N2 and (d) H3N2 are plotted against herd size for finishing farms (left) and farrow-to-finish farms (right). The black lines denote 95% binomial confidence intervals. The coloured lines show the best-fit univariate logistic regression model between herd size and mean seroprevalence. The coefficient for the relationship between seroprevalence and finishing herd size was significant for all subtypes on finishing farms (β = 1.9 × 10⁻⁴, p < 0.001), H1N1 on farrow-to-finish farms (β = −1.5 × 10⁻³, p < 0.001) and H1N2 on both finishing farms (β = 4.8 × 10⁻⁴, p < 0.001) and farrow-to-finish farms (β = 1.0 × 10⁻³, p < 0.05). All other coefficients for the relationship between seroprevalence and herd size were not significant (p > 0.05). (Online version in colour.)

