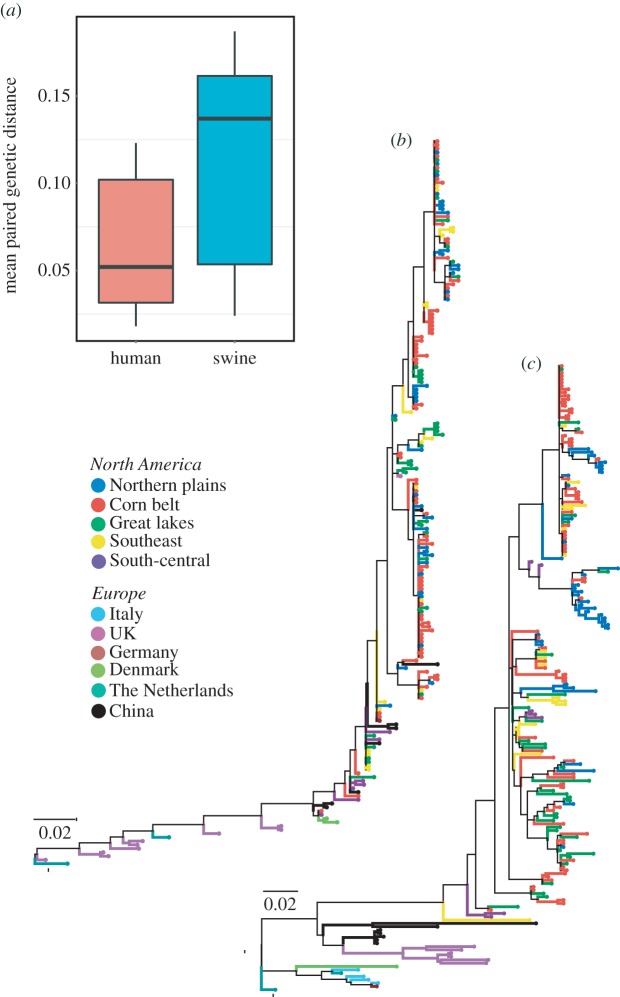
Figure 6.
Phylogenetic analysis of H3 influenza virus sequences from human and swine. (a) Box plot of the average between region/country distances for both swine and human sequences. These distances summarize the number of amino acid substitutions per site from averaging over all sequence pairs between groups (regions). A two-sample Kolmogorov–Smirnov test was used to compare the distributions of these mean group distances. Phylogenetic trees with the highest resulting likelihood are displayed for (b) human IAV and (c) swine IAV. Branches are colour-coded according to region. The percentage of trees in which the associated taxa clustered together is shown next to the branches whose length scales with the number of substitutions per site.

