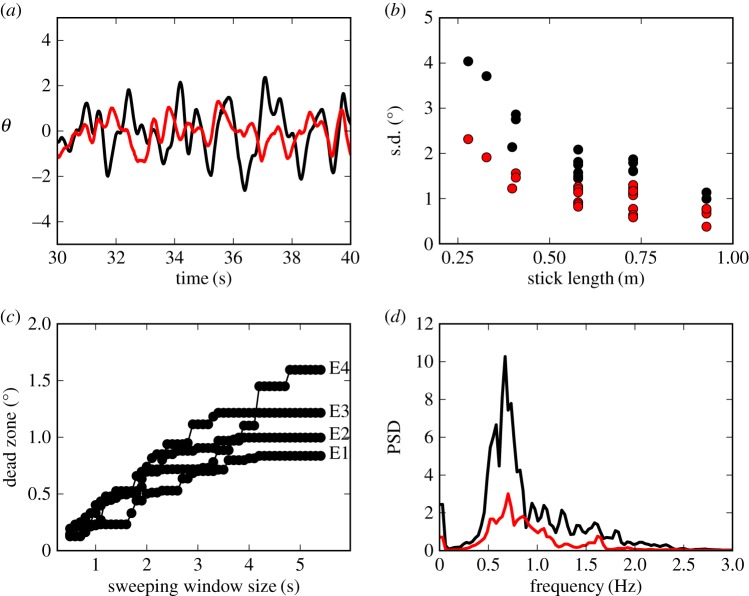
Figure 3.
(a) Comparison of the amplitude of the fluctuations of θ in the AP (black) and ML (red) directions for subject E1 balancing a 0.56 m stick. (b) The standard deviation (s.d.) for the fluctuations in the AP and ML direction as a function of ℓ for subjects E1–E4. (c) Estimation of Π when  for E1–E4 using the sweeping window method (see text). (d) The PSD for
  (black line) and
  (red line) for E3. The data and computer program for estimating the dead zone are available at https://datadryad.org/resource/doi:10.5061/dryad.73q8s.

