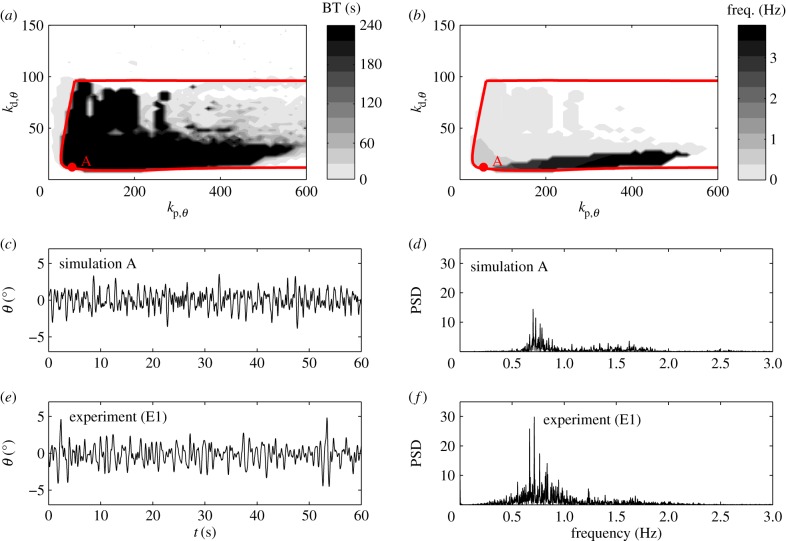
Figure 5.
(a) Red dashed curve shows the linear stability boundary for the model as a function of  with
with  and
and  for a 0.56 m stick when
  °. The grey scale shows the maximum BT for the nonlinear model with movement constraints and
  (values longer than 240 s are recorded as 240 s). (b) The same as (a) except that the grey scale shows the peak in the PSD at the parameter points, where BT = 240 s. Panels (c,e) and (d,f) show, respectively, the fluctuations in θ and the PSD for the model with
  and
and  (point A in panel a) and for subject E1. The data and computer program for the model are available at https://datadryad.org/resource/doi:10.5061/dryad.73q8s.

