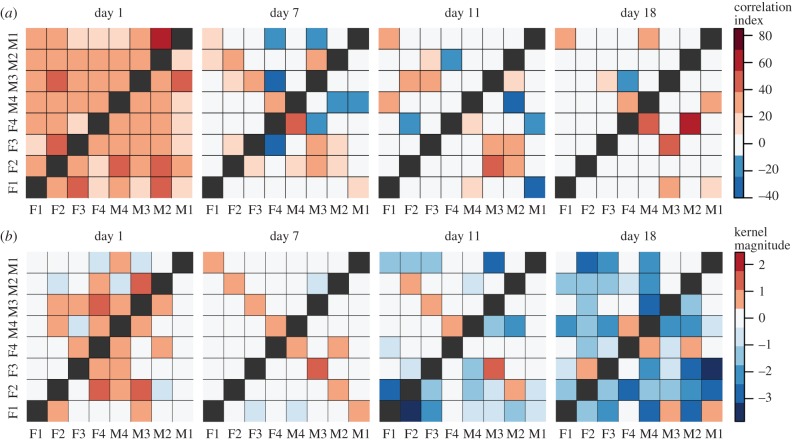
Figure 8.
Interindividual influence strengths for the dataset of Gill et al. considering all call types pooled together and analysed using cross-correlation (a) or GLMpp (b). In each matrix, individuals are arranged so that the cells on the counter-diagonal are the intra-pair influences (e.g. F1 to M1). Self–self influences are omitted for visual clarity (black squares on diagonal). For the GLMpp analysis, PCA kernel magnitudes are plotted, with polarity used to indicate whether each kernel's main peak is excitatory or inhibitory.

