Figure 9.

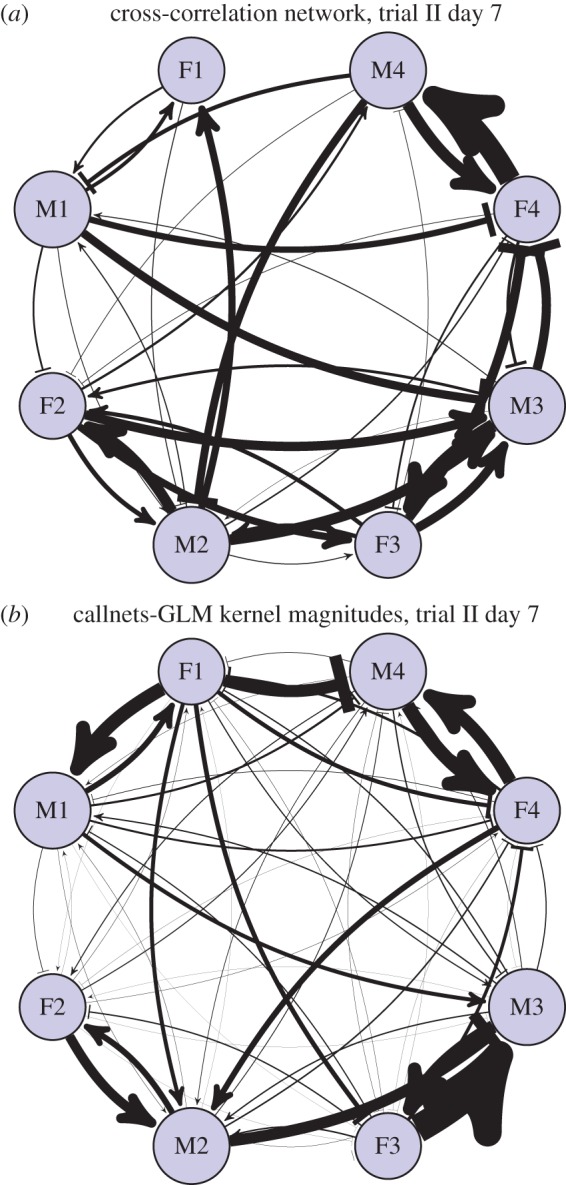
Network plot of interindividual influence strengths for the dataset of Gill et al. on day 7, considering all call types pooled together and analysed using cross-correlation (a) or GLMpp (b). See also figure 8. (Online version in colour.)

Network plot of interindividual influence strengths for the dataset of Gill et al. on day 7, considering all call types pooled together and analysed using cross-correlation (a) or GLMpp (b). See also figure 8. (Online version in colour.)