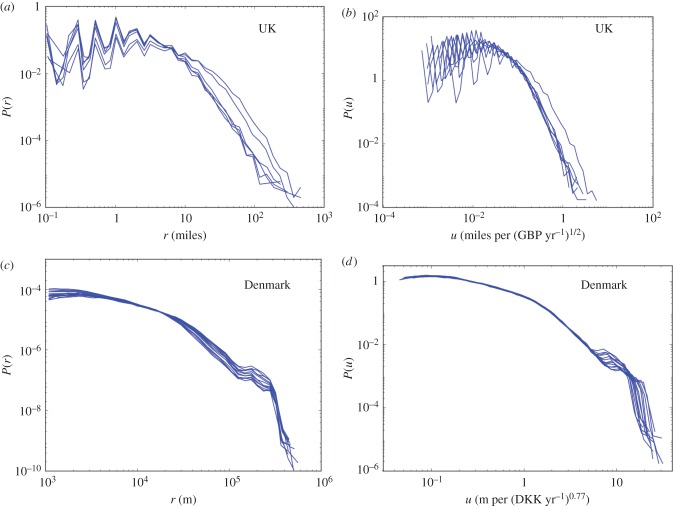
Figure 3.
(a,c) Commuting distance distribution for different income classes. The probability distribution is shown for different income classes. (a) UK data (averaged over all available years). (c) Danish data (all years give the same result and we choose here to show the year 2008). (b,d) Rescaled probability distribution P(u) for different income classes. We observe a very good data collapse for both UK data (b), with β ≈ 0.5 and averaged over all available years, and the Danish data (d) for β ≈ 0.77 and for the year 2008. (Online version in colour.)

