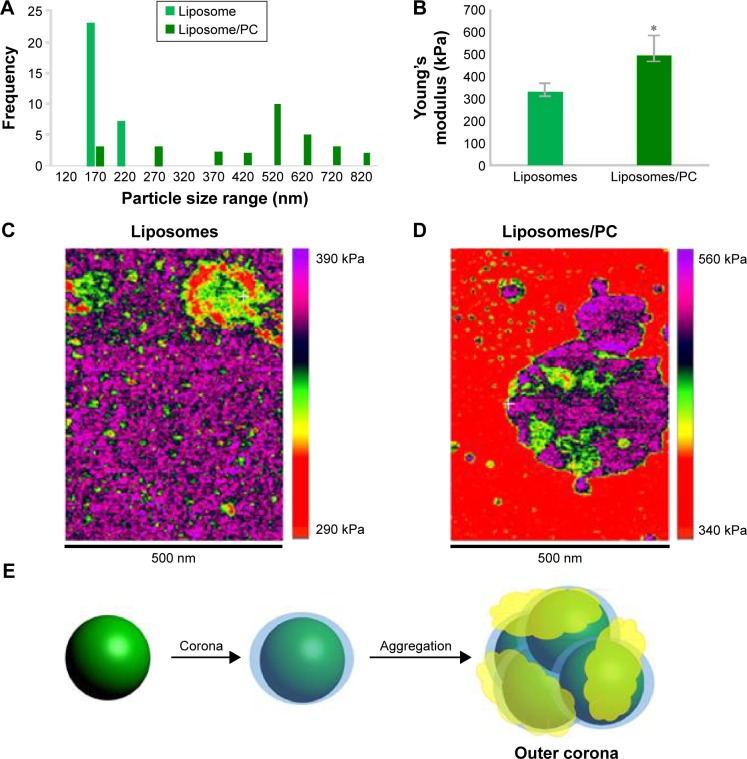
Figure 2.
AFM showing the impact of the PC on the mechanical properties of liposomes.
Notes: Size distribution of liposomes and liposome–PCs (A). Young’s modulus property quantification (B). Young’s modulus property map of representative liposome (C) and liposome–PC (D) samples with AFM. Schematic representation of liposome aggregation process following exposure to plasma (E).
Abbreviations: AFM, atomic force microscopy; PC, protein corona.

