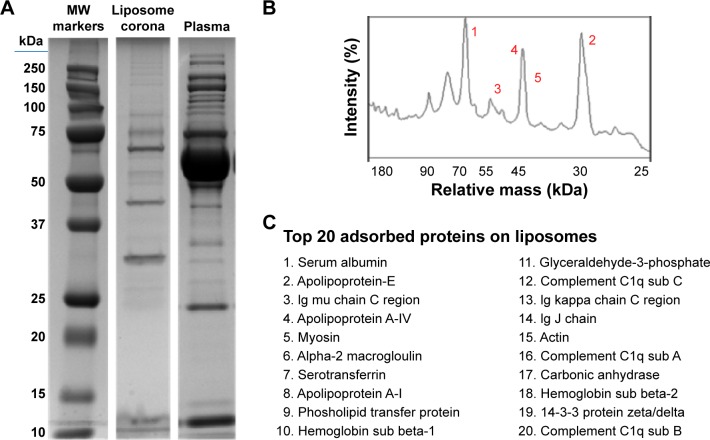
Figure 3.
Proteomic analysis of the PC of liposomes.
Notes: Liposomes were incubated for 1 hour at 37°C in plasma under agitation (A). NPs were centrifuged and extensively washed, and the PC was eluted in SDS loading buffer. SDS-PAGE (12% acrylamide) was carried out at 120 V for 90 minutes. Plasma was loaded as a control. Gels were Coomassie-stained. Plasma proteins on the surface of liposomes were quantified by densitometric analysis. The top five most abundant proteins are labeled by number in the graph (B). The top 20 most abundant proteins in the liposomes PC (C). Bands were selected and identified by LC-MS.
Abbreviations: PC, protein corona; NP, nanoparticle; SDS-PAGE, sodium dodecyl sulfate-polyacrylamide gel electrophoresis; LC-MS, liquid chromatography-mass spectrometry; MW, molecular weight.

