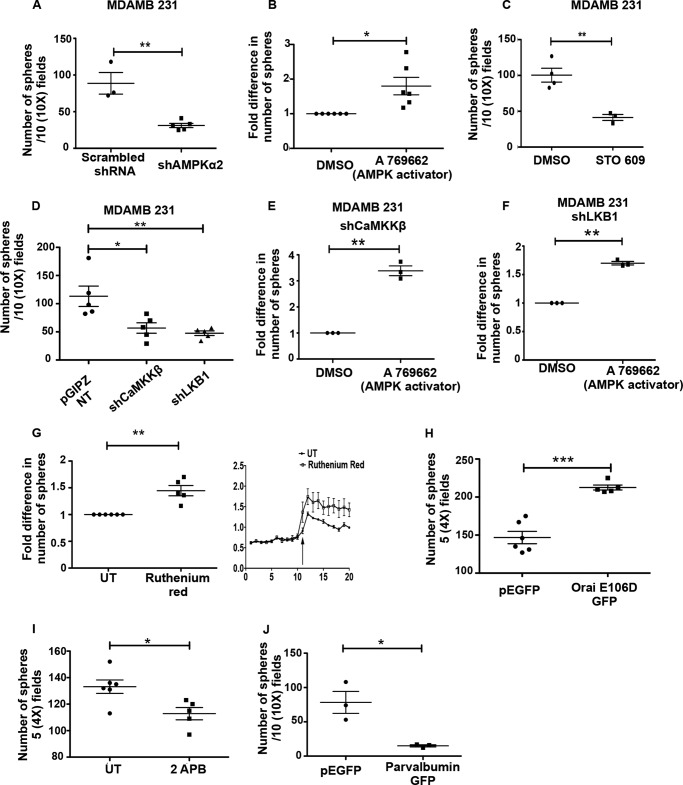
FIGURE 9.
AMPK signaling and intracellular calcium promotes sphere formation. A, MDA-MB 231 cells expressing either scrambled shRNA or shRNA against AMPKα2 were subjected to anchorage-independent sphere formation assay. Numbers of spheres (having more than 10 cells) were counted from 10 independent random fields under ×10 magnification. The scatterplot represents results from at least three independent experiments with two technical replicates each. Error bars represent ± S.E.; **, p < 0.01. B, MDA-MB 231 cells treated with DMSO (vehicle control) or A769662 were subjected to anchorage-independent colony formation. The scatterplot represents relative fold change from three independent experiments with two technical replicates each. Error bars represent ± S.E.; *, p < 0.05. C, MDA-MB 231 cells were treated with STO-609 and subjected to anchorage-independent sphere formation assay. Graph represents results from three independent experiments. Error bars represent ± S.E.; **, p < 0.01. D, MDA-MB 231 NT, shLKB1, and shCaMKKβ cells were subjected to anchorage-independent sphere formation assay and quantified as described above. The scatterplot represents the number of spheres from five independent biological sets; **, p < 0.01; *, p < 0.05. Error bars represent ± S.E. E and F, MDA-MB 231 shCaMKKβ cells (E) and shLKB1 cells (F) were treated with DMSO or A769662 and subjected to anchorage-independent sphere formation assay and quantified as described above. Error bars represent ± S.E.; **, p < 0.01. G, MDA-MB 231 cells treated with either vehicle control (UT) or ruthenium red (25 μm) were subjected to anchorage-independent sphere formation assay and quantified as described above. Error bars represent ± S.E.; **, p < 0.01. MDA-MB 231 cells were loaded with Fura 2 AM, and calcium measurements were carried out as described under “Experimental Procedures” in UT and ruthenium red-treated cells. H, MDA-MB 231 cells expressing either GFP or Orai E106D GFP were subjected to anchorage-independent sphere formation assay and quantified as described above. Number of spheres were counted in five random ×4 fields per dish. Graph represents results from three independent experiments with three technical replicates each. Error bars represent ± S.E.; ***, p < 0.001. I, MDA-MB 231 cells were treated with either vehicle control (UT) or 2-APB (100 μm) and were subjected to anchorage-independent sphere formation assay and quantified as described above. Error bars represent ± S.E.;*, p < 0.05. J, MDA-MB 231 cells expressing either GFP or parvalbumin GFP were subjected to anchorage-independent sphere formation assay and quantified as described above. Number of spheres were counted in 10 random ×10 fields per dish. Graph represents results from three independent experiments. Error bars represent ± S.E.; *, p < 0.05.

