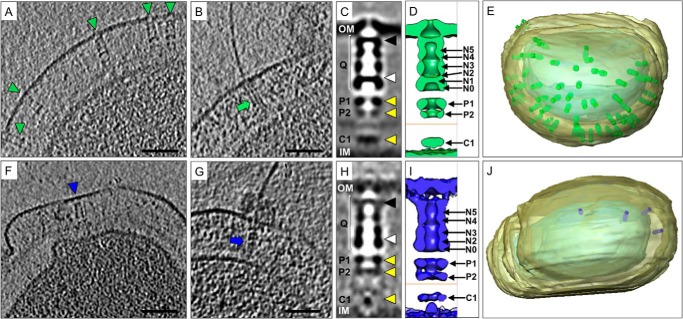
FIGURE 5.
Subtomogram averaging of the in situ T4P machinery from wild-type and pilQΔN1 mutant cells. A–J, representative data from wild-type cells (A–E) and from the ΔN1 mutant (F–J). Tomographic slices of T. thermophilus wild-type cells (A and B) and ΔN1 mutant cells (F and G) show the T4P machinery in the closed (A and F, blue and green arrowheads) and open, pilus-assembled (B and G, blue and green arrows) state. Scale bars = 50 nm. Subtomogram averaging reveals the three-dimensional structure of the wild-type (C) and ΔN1 (H) closed-state complexes. PilQ (Q) is indicated with white brackets, the position of gate 1 with a black arrowhead, gate 2 with a white arrowhead, and the positions of accessory proteins P1, P2, and C1 with yellow arrowheads. The outer membrane (OM) and inner membrane (IM) are also shown. D and I, the corresponding averages are shown as surface representations. The position of the peptidoglycan layer is indicated with an orange line, and the positions of the ring domains and accessory proteins are also shown. E and J, docking the subtomogram averages back into the corresponding tomographic volumes reveals the number and distribution of T4P complexes in whole cells.

