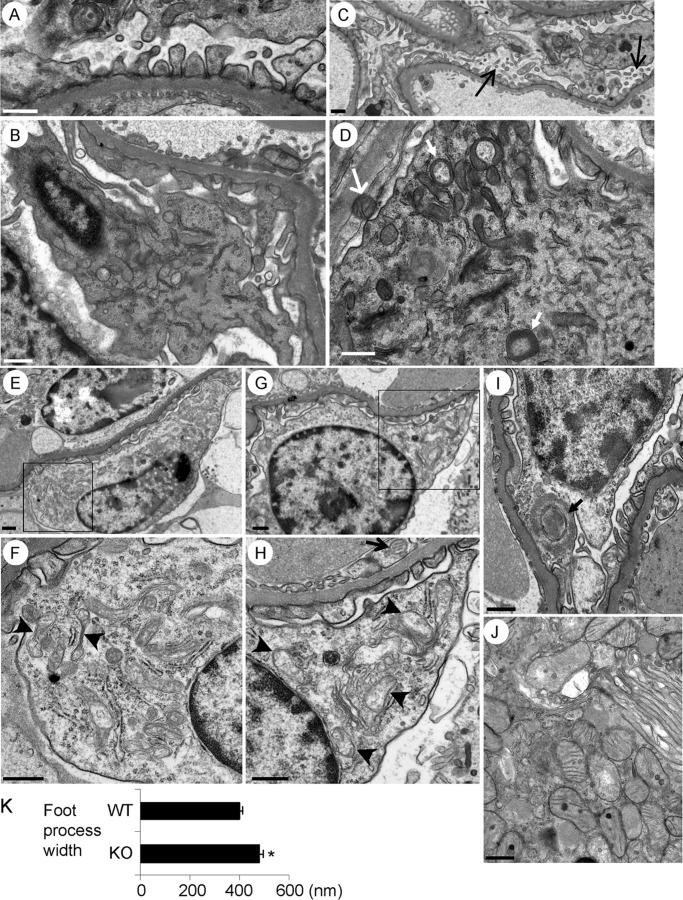
FIGURE 2.
Kidney cell ultrastructure in 10–11-month-old mice (electron microscopy). A, podocyte foot processes in iPLA2γ-KO mice appeared structurally intact. B, podocyte from a WT, control mouse shows intact cell organelles, including mitochondria. C, podocytes from an iPLA2γ KO mouse show microvillous transformation and membrane vesiculation (arrows). D–I, podocytes from iPLA2γ-KO mice show abnormal mitochondria and autophagic vacuoles. F and H, magnified views of the areas in E and G outlined by boxes, respectively. Mitochondria in podocytes show aggregation, disruption of membranes, and loss of cristae (arrowheads in F and H), whereas some mitochondria appear to be undergoing fission (F). In D and I, the closed arrows point to autophagosomes in podocytes. Mitochondria in a parietal epithelial cell (open arrow, D) and a glomerular endothelial cell (open arrow, H) appear normal. The ER (F and H) and nuclei (E–I) in podocytes appear intact. J, proximal tubular epithelial cell from an iPLA2γ-KO mouse shows normal mitochondria. The brush border is seen on the top right of the photomicrograph. Bar, 500 nm. Glomeruli were examined in five KO and three WT mice, 2–3 glomeruli/mouse. K, quantification of foot process width in iPLA2γ-KO and WT mice. *, p < 0.0005 KO versus WT (21–22 measurements/group). Error bars, S.E.

