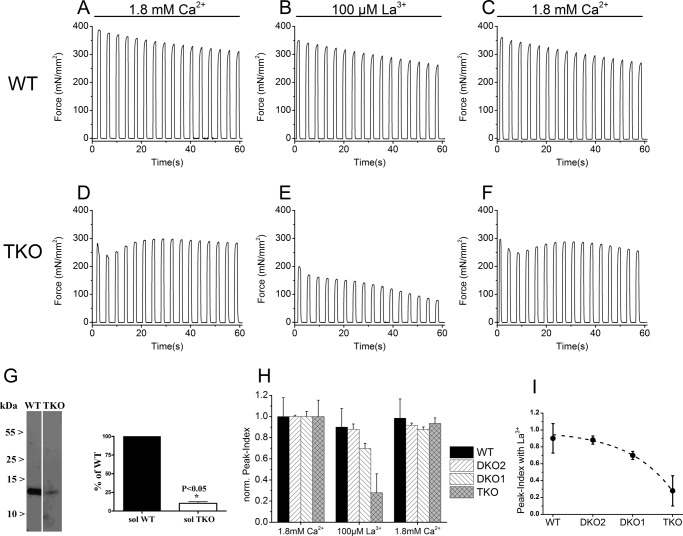
FIGURE 8.
Tetanic contraction of Soleus from WT/DKO1/DKO2 and TKO mice. Panels A–F, traces of a train of tetanic contractures in wild-type and TKO carried out according the protocol described under “Experimental Procedures.” Shown is a representative response of 9 muscles from 10 mice. Panel G, Western blot of 37.5 μg of total homogenate of soleus from WT and TKO stained with anti-parvalbumin Ab. Histograms report values (mean ± S.D.) from four to six determinations from three different total homogenate preparations. Values are the mean ± S.D. *, p value of unpaired Student's t test. Panel H, normalized peak indexes of four strains. Values are the mean ± S.D. of 4–6 muscles from 2 or 3 mice; in the presence of 100 μm La3+ the overall ANOVA p values are <0.0001; multicomparison Dunnett's ANOVA post test: WT versus DKO2, p > 0.05; WT versus DKO1, p < 0.05; WT versus TKO, p < 0.05. Panel I, exponential curve fitting of the values of the peak indexes in the presence of La3+ values, which are reported in panel H.

