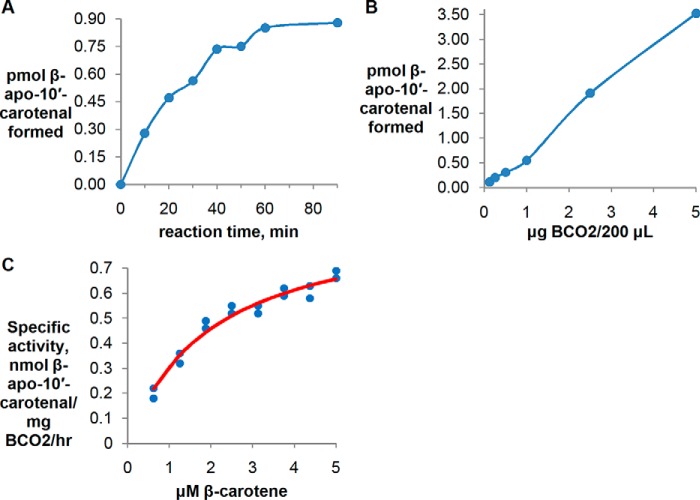
FIGURE 3.
Kinetic data for purified recombinant chicken BCO2 with β-carotene at 37 °C. Each data point represents the difference between the average of duplicate measurements at a given reaction time and the average of duplicate time 0 controls. A, time course using 5 μm β-carotene incubated with 1000 ng of BCO2. B, protein curve using 5 μm β-carotene and a 30-min reaction time. C, plot of reaction velocity as a function of β-carotene concentration using 1 μg of BCO2/200-μl reaction and a 30-min reaction time. The results of two independent experiments (two different preparations of purified protein) are shown and fit to the Michaelis-Menten equation. The red trace is the best fitting Michaelis-Menten curve generated by GraphPad Prism 4.

