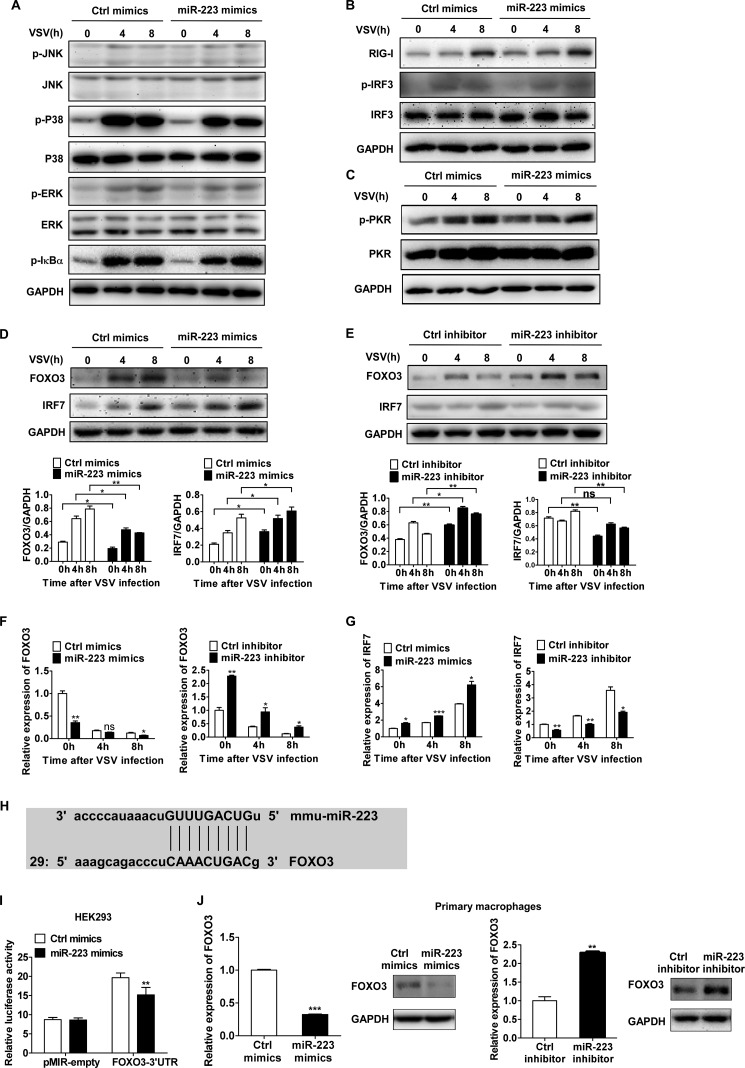
FIGURE 4.
miR-223 enhances IRF7 expression by targeting FOXO3. A–C, 0.5 ml of 2 × 10⁵ mouse peritoneal macrophages were transfected with control (Ctrl) mimics or miR-223; after 48 h, cells were infected by VSV at m.o.i. 10. Phosphorylated (p-) or total proteins in lysates were detected by immunoblot at the indicated times. D and E, 0.5 ml of 2 × 10⁵ mouse peritoneal macrophages were transfected with miR-223 mimics or inhibitors; after 48 h, cells were infected by VSV at m.o.i. 10. Total protein levels of FOXO3 and IRF7 in lysates were detected by immunoblot at the indicated times. Band intensity was calculated using ImageJ software, and ratios of FOXO3/GAPDH or IRF7/GAPDH were determined. F and G, FOXO3 mRNA (F) and IRF7 mRNA expression (G) were measured by qPCR and normalized to the expression of β-actin in each sample. H, alignment of miR223 and its target sites in 3′-UTR of FOXO3 is shown. I, HEK293 cells were cotransfected with pMIR-REPORTTM FOXO3–3′-UTR luciferase reporter plasmid or empty pMIR-REPORTTM and pTK-RL plasmid, together with miR-223 mimics. After 24 h, firefly luciferase activity was measured and normalized by Renilla luciferase activity. J, 0.5 ml of 2 × 10⁵ mouse peritoneal macrophages were transfected with miR-223 mimics or inhibitors; after 48 h, FOXO3 mRNA and protein levels were detected by qPCR and immunoblot. Data are the mean ± S.D. (n = 3) of one representative experiment. Similar results were obtained in three independent experiments. ***, p < 0.1; **, p < 0.01; *, p < 0.05; ns, not significant.

