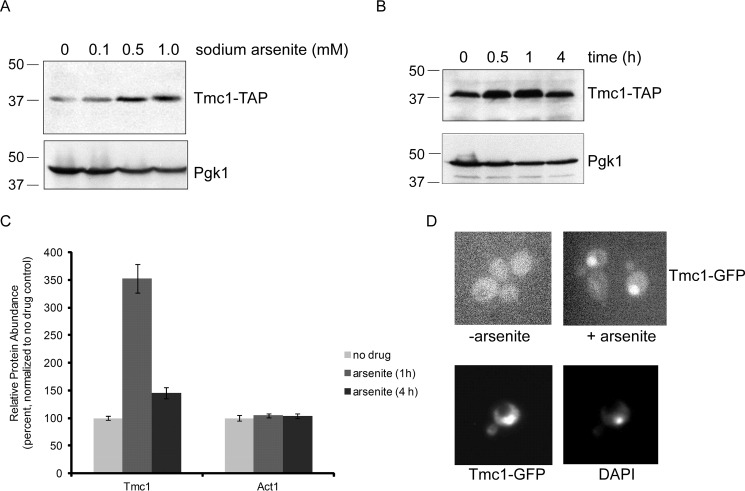
FIGURE 1.
Dynamic regulation of Tmc1 protein levels after arsenic treatment. A, Tmc1-TAP protein levels after treatment with sodium arsenite at the indicated concentrations. Whole cell extracts were prepared and analyzed by SDS-PAGE followed by immunoblot. Upper panel, anti-TAP antibody. Lower panel, anti-Pgk1 antibody (loading control). Molecular weight markers are indicated (kDa). B, Tmc1-TAP protein levels after treatment with sodium arsenite (1 mm) at the indicated time points. Whole cell extracts were prepared and analyzed by SDS-PAGE followed by immunoblot. Upper panel, anti-TAP antibody. Lower panel, anti-Pgk1 antibody (loading control). C, relative protein abundance of Tmc1 at 0, 1, and 4 h after treatment with sodium arsenite (1 mm). The data were generated using a TMT-based mass spectrometry proteomic approach (11). The data shown represent endogenous untagged Tmc1 protein. A control protein, Act1, showed no change. The error bars represent standard deviations from triplicate cultures. In addition, differences between untreated and treated Tmc1 samples were statistically significant by Student's t test (p < 0.01); differences between untreated and treated Act1 samples were not statistically significant. D, induction of Tmc1 after treatment with sodium arsenite (1 mm for 1 h), as visualized by fluorescence microscopy using GFP-tagged Tmc1 protein (upper panels). Staining with the nuclear marker DAPI indicates that induced Tmc1-GFP is mainly nuclear (lower panels).

