FIGURE 6.
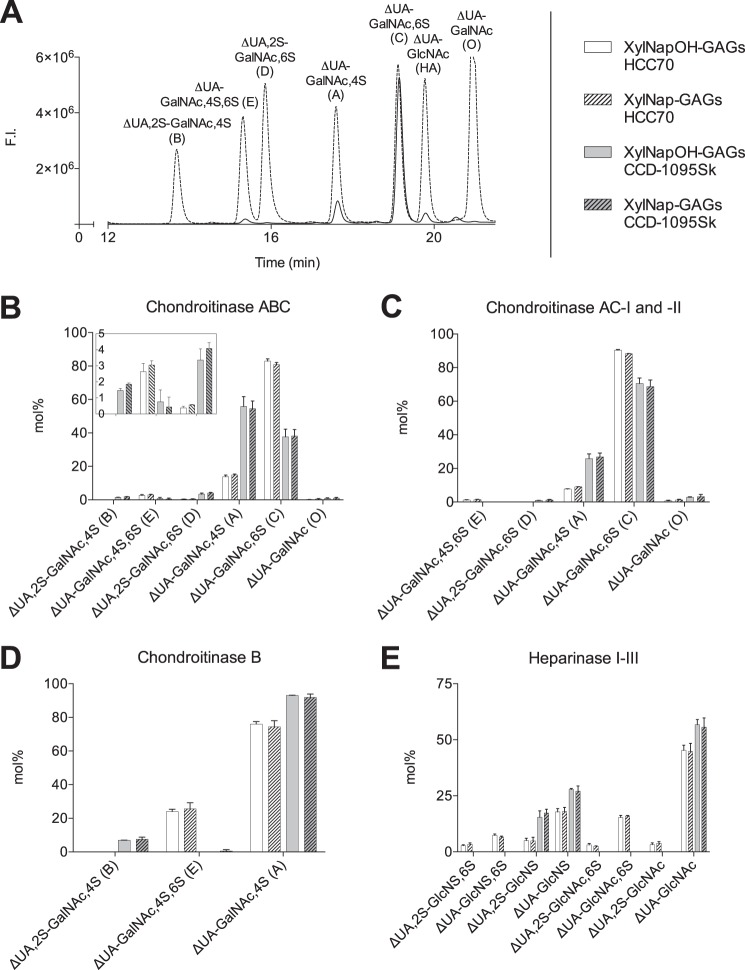
Disaccharide composition of XylNapOH- and XylNap-primed GAGs from HCC70 cells and CCD-1095Sk cells. A, typical chromatogram from separation on an XBridge BEH Shield RP18 (2.1 × 100 mm, 2.5 μm) column of chondroitinase ABC-degraded and 2-aminoacridone-labeled XylNapOH-primed GAGs from HCC70 cells (solid line) and CS/DS standards (dashed line). The different disaccharides are indicated above the corresponding peaks. ΔUA-GlcNAc (hyaluronic acid (HA)) is indicated but was not investigated in the study. Excitation λ = 425 nm, and emission λ = 525 nm. F.I., fluorescence intensity. The disaccharide data presented in B–E was estimated by the corresponding chromatograms. B–E, disaccharide fingerprint from XylNapOH- and XylNap-primed GAGs from HCC70 cells and CCD-1095Sk cells after enzymatic degradation using chondroitinase ABC (B), chondroitinase AC-I and -II (C), chondroitinase B (D), and heparinase I-III (E). The inset in B displays the data of disaccharides ΔUA,2S-GalNAc,4S (B), ΔUA-GalNAc,4S,6S (E), and ΔUA,2S-GalNAc,6S (D), where the y axis ranges from 0 to 5 mol%. The data are the means of two independent experiments ± S.D. Raw data can be found in supplemental Tables S1 and S2.

