Figure 5.
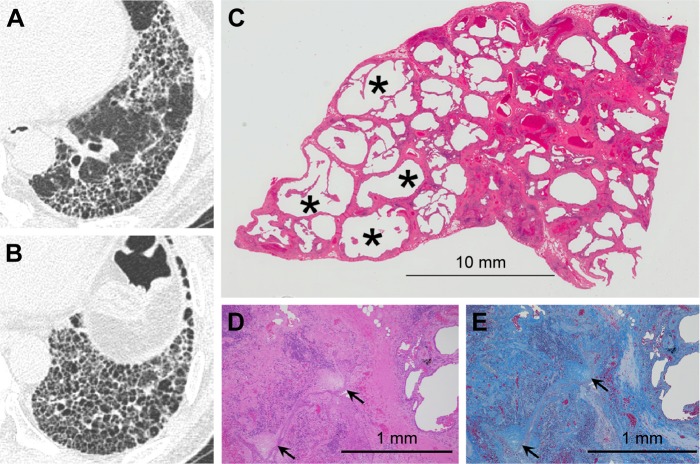
UIP pattern on thin-section CT images and histological findings.
Notes: (A and B) Thin-section CT images showing clustered cysts of similar size and shape. Note surrounding ground-glass attenuation with reticular opacity. (C) This low-power photograph of the histological section (hematoxylin–eosin stain) reveals macroscopic honeycombing (asterisk) corresponding to honeycombing on thin-section CT images and patchy fibrosis with architectural distortion and microscopic honeycombing reflecting ground-glass attenuation with reticular opacity. (D) Note dense fibrosis and fibroblastic foci (arrow) on high-power photographs of the histological section. (E) Masson’s trichrome stain reveals architecture destruction with scattered fibroblastic foci (arrow).
Abbreviations: UIP, usual interstitial pneumonia; CT, computed tomography.

