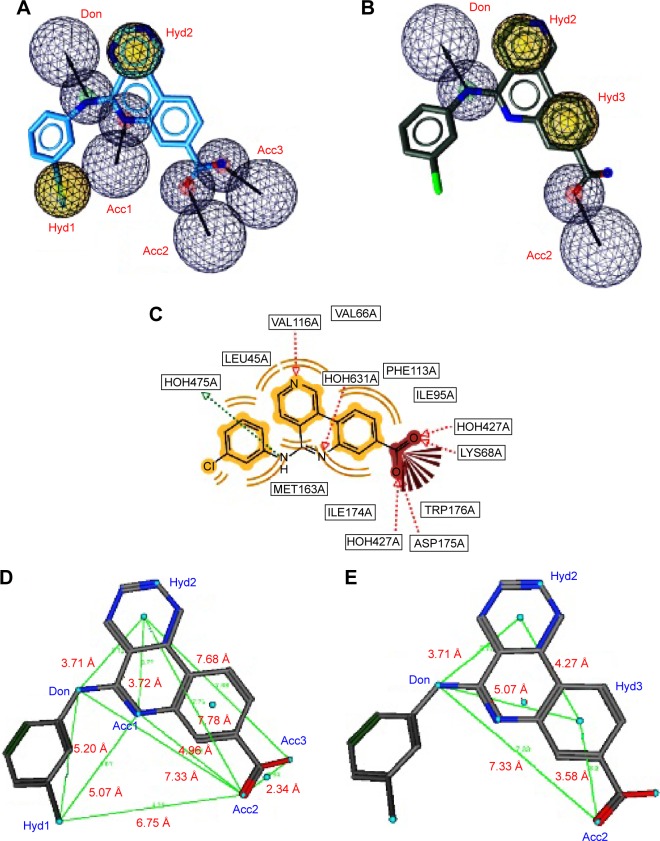
Figure 2.
Two sets of combinations of high-performance pharmacophore models for the 3PE1 target.
Notes: For (A and B), the highlighted pharmacophore features are located on the atomic centers of the native ligand, with HBDs and HBAs in blue and hydrophobic centers in yellow, for the two pharmacophore models (3PE2-I and 3PE1-II, with carbon atoms portrayed in cyan and gray, respectively). (C) Interactions between native ligand and target site amino acid residues, with hydrophobic interactions shown in light brown, HBD interactions with the native ligand in green, and acceptor interactions in red. For (D and E), representing 3PE1-I and 3PE1-II, respectively, the locations of centers of pharmacophore features on the native ligand show distances between the centers, with distance measurements shown in red. These are the best overall performing pharmacophore models in this study.
Abbreviations: HBDs, H-bond donors; HBAs, H-bond acceptors.

