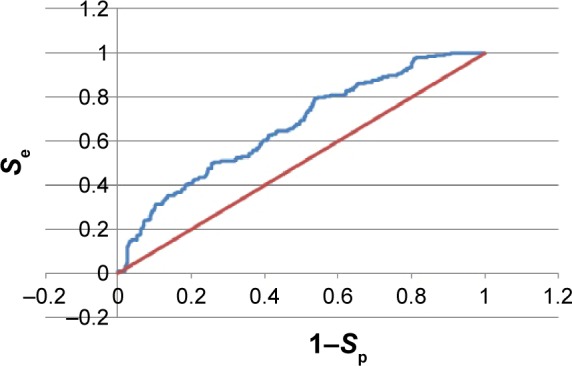
Figure 5.

The ROC curve for the 3PE1-I pharmacophore model.
Note: The ROC curve is shown in blue, while the random line is shown in red.
Abbreviation: ROC, receiver operating characteristic.

The ROC curve for the 3PE1-I pharmacophore model.
Note: The ROC curve is shown in blue, while the random line is shown in red.
Abbreviation: ROC, receiver operating characteristic.