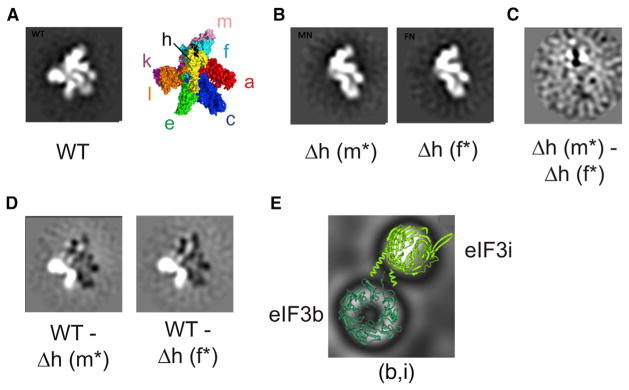
Figure 3. Negative-Stain 2D Class Averages ofNeurospora eIF3 and eIF3 Subcomplexes.
(A) Negative-stain image of WT eIF3 with an N-terminal FLAG tag on subunit e. The structural model of human eIF3 from cryo-EM reconstructions is included as a comparison (PDB: 5A5T) (des Georges et al., 2015).
(B) Negative-stain images of eIF3 purified from eIF3Δh strains, with N-terminal FLAG tags on either subunit m (Δh m*) or subunit f (Δh f*).
(C) 2D difference map between eIF3 complexes Δh m* and Δh f*.
(D) 2D difference maps between WT eIF3 and either Δh m* or Δh f*. White and black regions in difference maps correspond to regions of the structure with net positive or negative density, respectively. The top five class averages for each complex are depicted in Figure S1.
(E) Class average of solenoid images with crystal structures of the WD-repeat domains of eIF3b (dark green) and i (light green) modeled. See also Figure S1.

