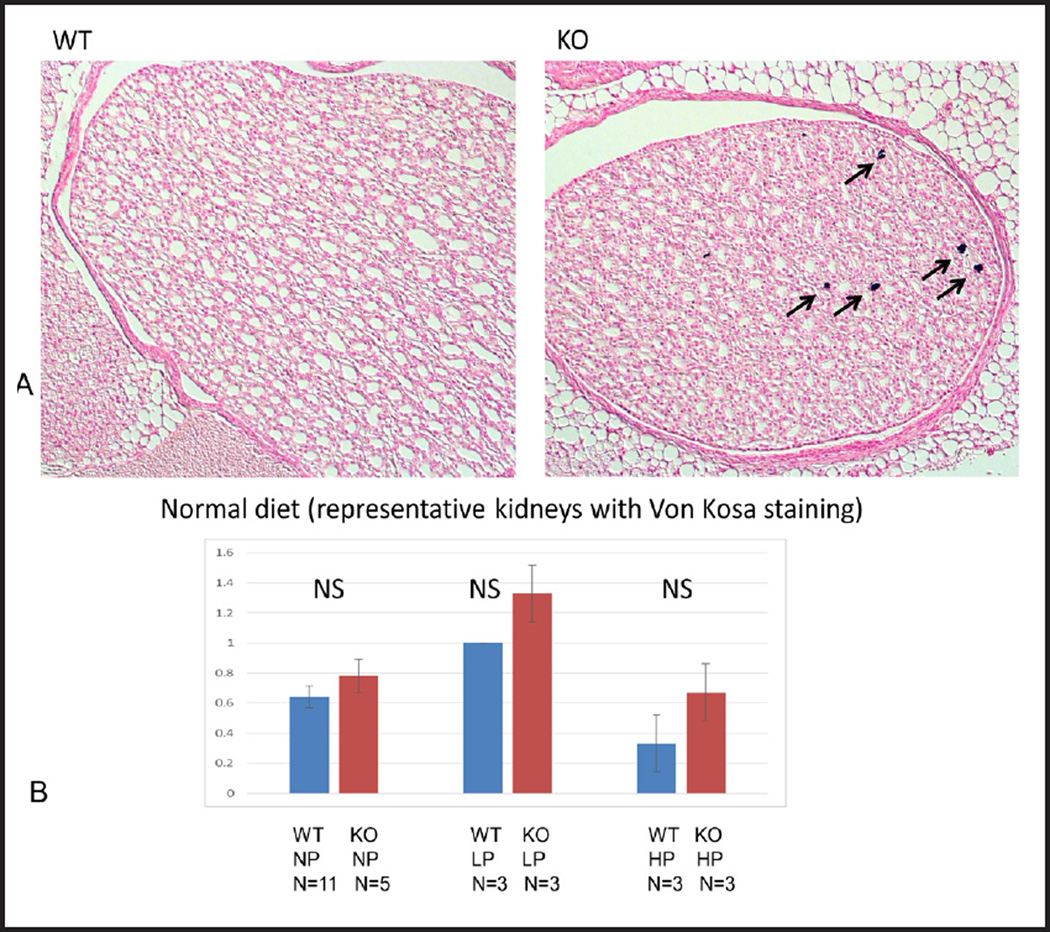
Fig. 10.
(A) Renal calcifications. Representative images of kidney sections of wt and STIM1 ko mice fed normal protein diet stained with Von Kossa. Arrows indicate calcium deposits in the papilla. Kidney sections are from 4 month old mice. (B) Nephrocalcinosis quantification. Columns represent averages ± standard errors of quantified calcium deposits of wt and STIM1 ko mice fed normal, low or high protein diet. Quantification was based on the following grading schema: 0 = no calcium, 1 = 1–4 calcium deposits, 2 = 5–8 calcium deposits, 3 = greater than 8 calcium deposits. Statistical analysis was performed using a paired two-tailed.

