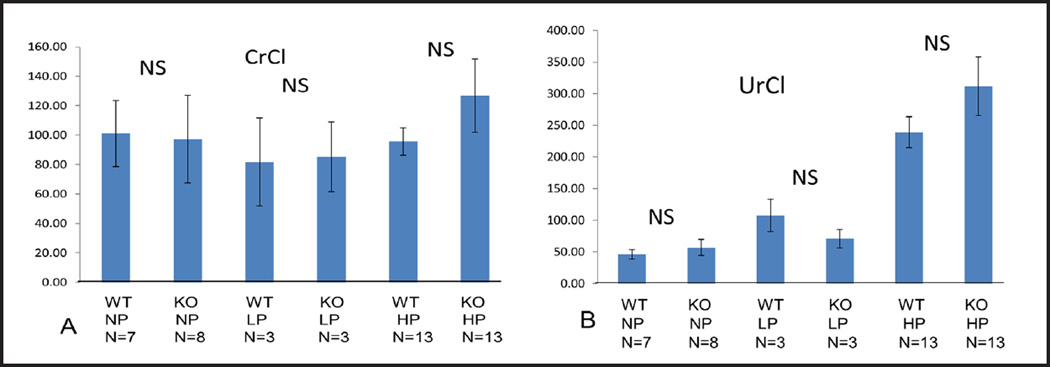
Fig. 6.
(A) Creatinine clearance (CrCl) (µl/min). Columns represent averages ± standard errors of CrCl of wt and STIM1 ko mice fed normal, low or high protein diet. Statistical analysis was performed using a paired two-tailed Student’s t test. (B) Urea clearance (UrCl) (µl/min). Columns represent averages ± standard errors of UrCl of wt and STIM1 ko mice fed normal, low or high protein diet. Statistical analysis was performed using a paired two-tailed Student’s t test.

