
Figure 3.
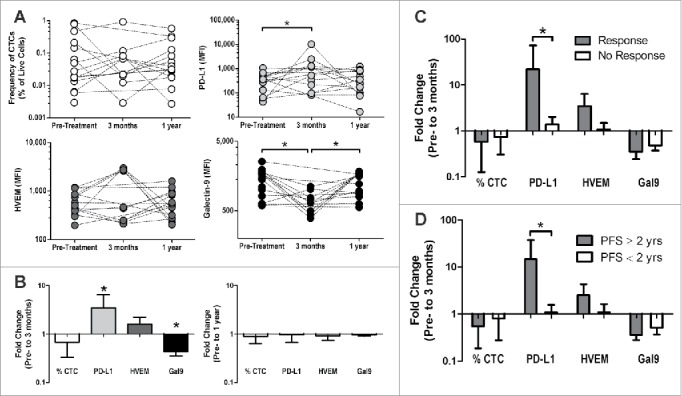
Changes in checkpoint ligand expression on CTCs correlate with the development of an immune response following DNA vaccination and longer progression-free survival. CTCs from PBMC of patients treated with a DNA vaccine encoding PAP (n = 15) were assessed for the expression of various checkpoint ligands pre-treatment, during treatment (3 mo) and at 1 y post-treatment. Of note, only 9 of the 15 patients analyzed at 1 y had samples available at 3 mo available for these analyses. (A) Frequency of CTC and the mean-fluorescence intensity (MFI) of PD-L1, HVEM, and Galectin-9 on the CTC are shown for all individual patients. *p < 0.05 using a Wilcoxon signed-rank test. (B) The log-transformed fold change (post/pre) is shown for both 3 mo and 1 y post-treatment. *p < 0.05 using a one-sample Wilcoxon signed rank test against a hypothetical median of 1 (no change). (C–D) Fold change (pre-treatment to 3 mo) was assessed in patients who developed a persistent immune response or not (responder n = 3, non-responder n = 6, as defined previously, C) or in patients whose progression-free survival was ≥ 2 y (n = 4) versus < 2 y (n = 5) (D). *p < 0.05 using a Mann–Whitney test.