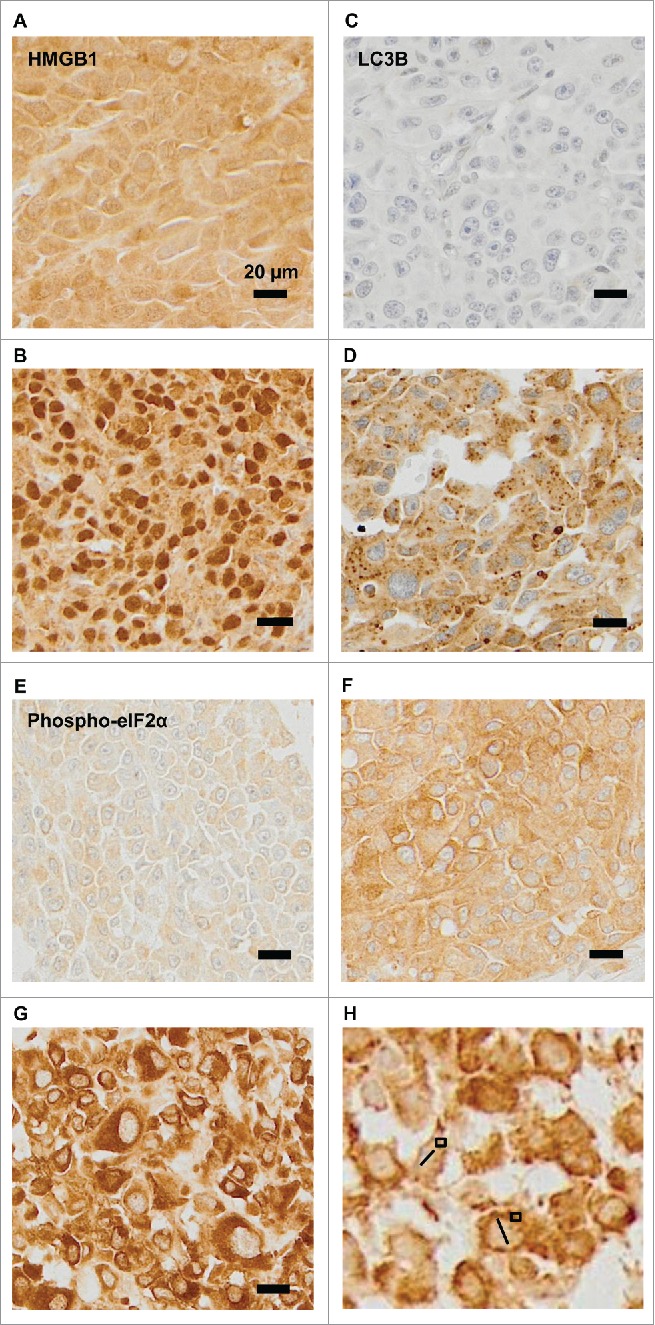
Figure 2.

Representative immunohistochemical staining patterns. (A–B) Representative images of melanomas that are heterogeneous with respect to the presence of HMGB1 within nuclei (absence: A, presence: B). (C–D) Representative images of melanomas differing in the percentage of cells positive for cytoplasmic LC3B puncta (absence: C, presence D). (E–H) Representative images of phospho-eIF2α-staining in melanoma metastases: (E): mild, (F): moderate, and (G): intense, (H): measures of nuclear diameters (bars), and phospho-eIF2α-staining intensity (squares).
