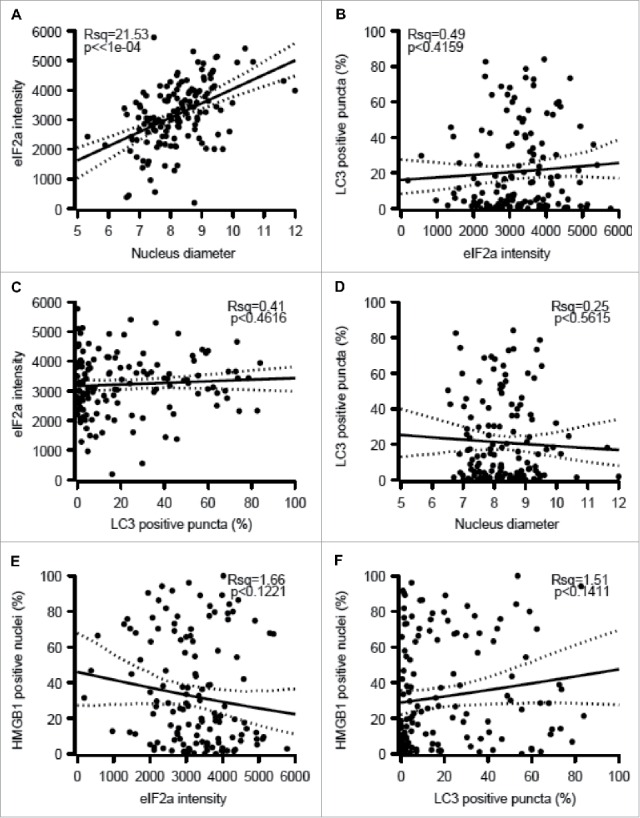
Figure 3.

Correlations among melanoma cell-intrinsic biomarkers. The indicated parameters were quantified: eIF2α as an intensity (A, C, E), nuclear diameter (B, D), LC3B as a frequency of cells exhibiting cytoplasmic puncta (C, E, F) and HMGB1 as a frequency of cells with positive nuclei (E, F) and the results were plotted against each other. psR^2: pseudo r-squared.
