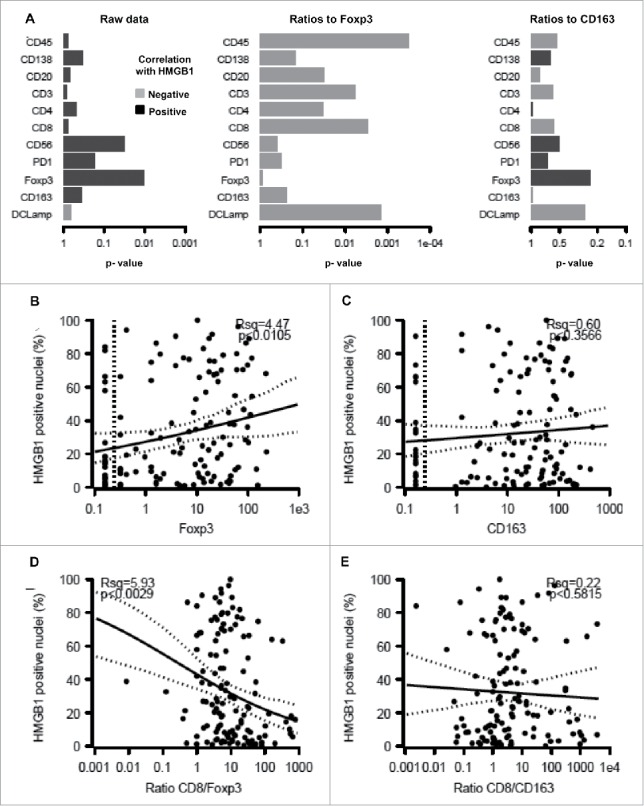
Figure 6.

Correlation between HMGB1 expression by melanoma cells and the immune infiltrate. The overall correlation between HMGB1 expression and individual immune parameters or the calculated ratios is shown (A). Also are shown the impact of HMGB1 expression on the infiltration by FOXP3+ T lymphocytes (B), CD163+ macrophages (C), the ratio of CD8+/FOXP3+ cells (D) and the ratio of CD8+/CD163+ cells (E).
