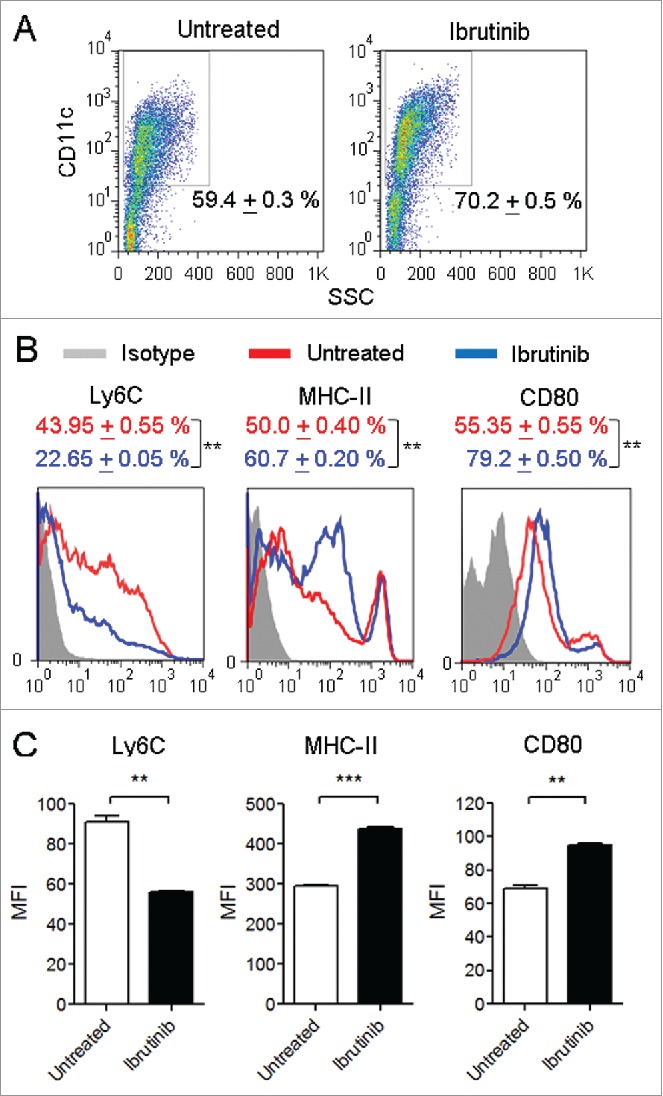
Figure 1.

Ibrutinib treatment enhances the development and maturation of DCs. (A) Dot plots show the percentages of CD11c+ DCs in untreated and ibrutinib-treated DC cultures. Numbers denote mean + SEM of duplicate percentage values. (B) Histograms show the expressions of Ly6C, MHC-II and CD80 in CD11c+ DCs from untreated and ibrutinib-treated DC cultures. Numbers denote mean + SEM of duplicate percentage values of cells expressing the respective surface molecule. (C) Mean fluorescence intensities of Ly6C, MHC-II and CD80 expression in CD11c+ DCs from untreated and ibrutinib-treated DC cultures. The data are presented as mean + SEM of duplicate MFI values. Bone marrow cells from C57BL/6 mice were cultured in the presence of GM-CSF, without or with 1 µM ibrutinib for 7 d to generate untreated and ibrutinib-treated DCs, respectively. At Day 7, DC cultures were stained with the fluorescently labeled antibodies for the respective surface markers and their expressions were determined by flow cytometry. The data presented are representative of three independent experiments. **p < 0.001, ***p < 0.0001.
