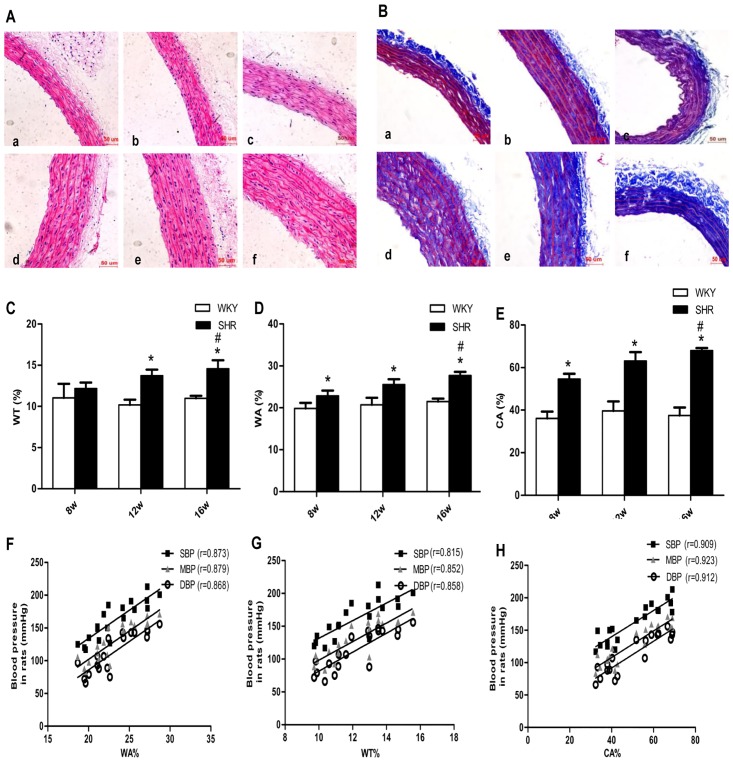
Fig 2. Changes related to proliferation and remodeling indices of vascular smooth muscle layer of rat thoracic aorta, and linear correlation analyses between BP and these variables.
a Representative photomicrographs showing hematoxylin and eosin staining (200 ×). b Representative photomicrographs showing Masson trichrome staining (200 ×). Masson trichrome-stained collagen appears blue in color. a Eight-week-old Wistar-Kyoto rat group (WKY8w). b Twelve-week-old Wistar-Kyoto rat group (WKY12w). c Sixteen-week-old Wistar-Kyoto rat group (WKY16w). d SHR8w. e Twelve-week-old SHRs group (SHR12w). fSHR16w. c-e Comparison of the wall thickness percentage of the external diameter (WT%) (c) Total vessel wall area as a percentage of the total area (WA%) (d) Total area occupied by collagen as a percentage of the total vessel wall area (CA%) (e) in different groups using Image-Pro Plus 6.0 software. f-h Analyses of correlation between BP and WA% (f) WT% (g) CA% (h), respectively, using Image-Pro Plus 6.0 software. Data are presented as means ± standard deviation. *P < 0.05 SHRs groups versus the age-matched WKY groups; #P < 0.05 SHR16w group versus SHR8w group; n = 7 in each group. P < 0.05 for each correlation coefficient (n = 7).

