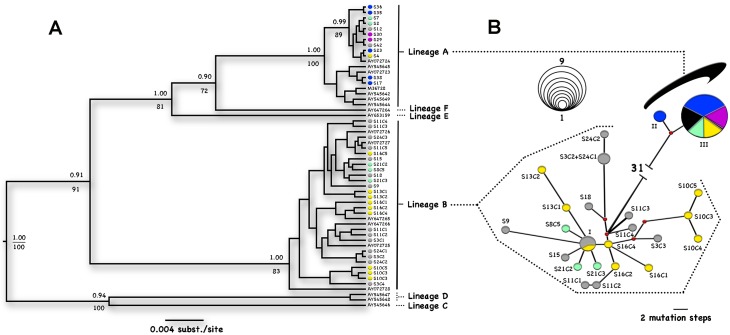
Fig 2. Evolutionary relationships of Giardia intestinalis.
Each locality is represented by a different color. (A) Phylogenetic consensus tree of the 56 βG clone sequences. Posterior probabilities (Bayesian reconstruction) >0.9 and bootstrap values (ML tree) >70 are shown above and below the nodes, respectively. GenBank accession numbers for samples sequenced in other studies are shown in the terminal branches. (B) Median-joining network with maximum-parsimony post-processing. Each circle represents a unique haplotype; nodes represent median vectors. The size of each node is proportional to the number of sequences that shared the same haplotype (see scale) and the branch size is proportional to the number of mutational steps. For improved graphic resolution, the distance between assemblages A and B is not proportional (31 mutational steps). Color key: Blue—APA; Yellow- SAN; Red- CEN; Purple- SJT; Gray- SI; Green- SJO. Sample IDs: I—S11C5, S16C5 and S24C3; II—S17 and S38; and III—S4, S7, S12, S23, S29, S30, S35, S36 and S42. The other IDs concord with Table 2.

