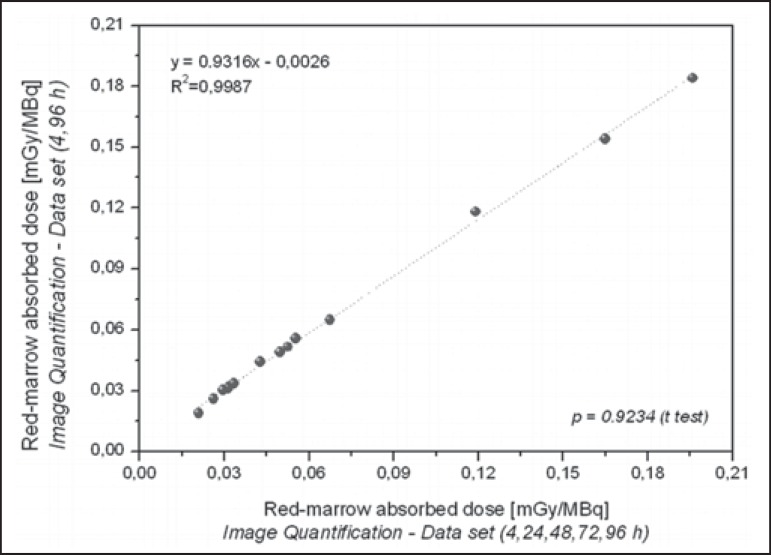
Figure 11.
Correlations between radiation doses to the red marrow calculated by considering measurements obtained at five time points (4, 24, 48, 72, and 96 h) and those calculated by considering measurements obtained at only two (4h and 96 h), using only radiometric data acquired with the image quantification method.

