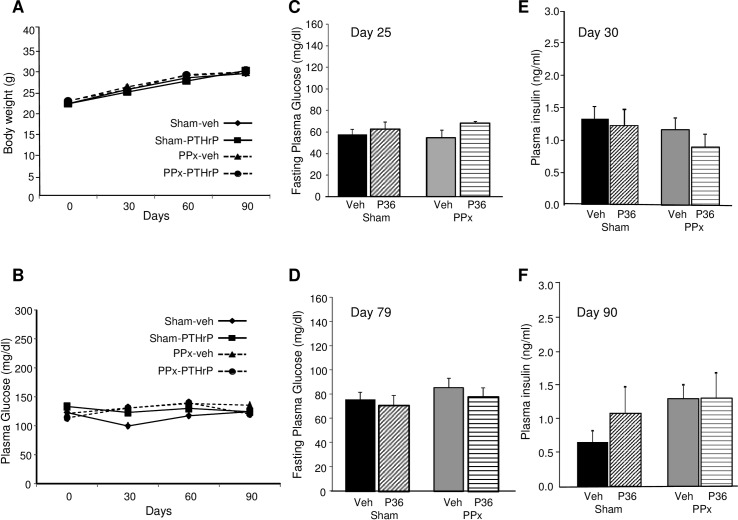
Fig 2. Body weight and glucose homeostasis.
Average (A) body weight and (B) blood glucose values at 30-day intervals in the sham (solid line) -veh (diamond), -PTHrP (square), and PPx (dotted line) -veh (triangle), -PTHrP (circle) mice, treated for 90 days (n = 6 mice/group). Fasting plasma glucose at (C) day 25 and (D) day 79, plasma insulin at (E) day 30 and (F) day 90 in the four groups of mice treated for 30 days (C, E, n = 4 mice/group) or 90 days (D, F, n = 5 mice/group), as represented in Fig 1.

